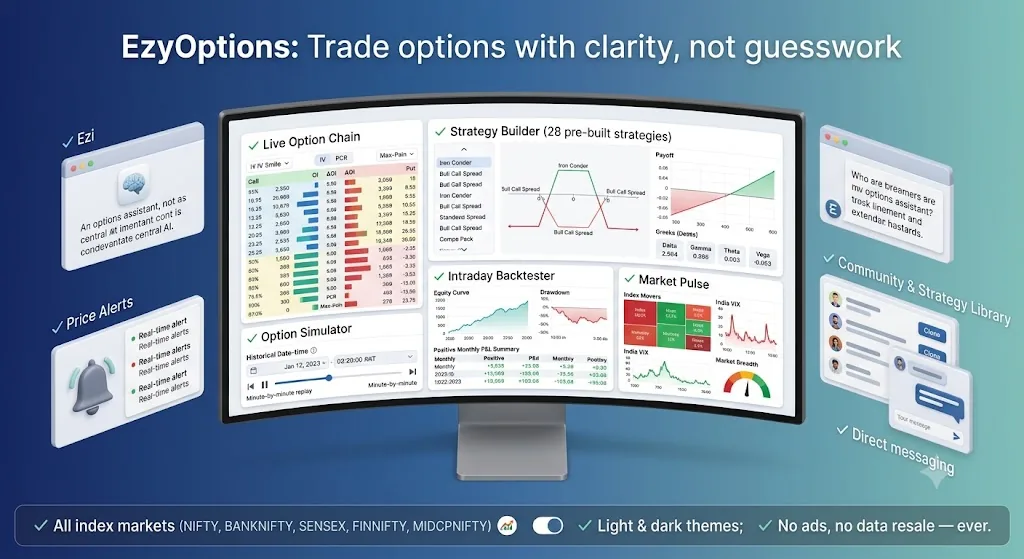
A full NSE option chain, a watchlist, a strategy builder, an AI Lab, a minute-by-minute simulator, an intraday backtester and paper trading, on one licensed live feed.
Live Option Chain
The full NSE option chain for every index we cover, refreshed live and laid out so the shape of the market is visible rather than something you assemble in your head. Strike by strike, calls on the left and puts on the right, with the at-the-money row marked.
Open interest is drawn as depth bars rather than printed as a number, because the question you are actually asking is where the weight sits, and a column of six-digit figures is the one presentation that hides it.
Max Pain, the put-call ratio and the at-the-money strike are computed across the whole chain as it updates, so the three numbers most often worked out by hand are simply there.
Twenty-eight ready-made option strategies: spreads, condors, butterflies, straddles and the rest. Or your own basket, built a leg at a time. Pick strikes from the chain and the position assembles itself.
The payoff curve redraws as you click, with breakevens, maximum profit and maximum loss recomputed on every change. So does the estimated margin, which is the number that decides whether a trade is affordable and is usually the last one anybody works out.
Overlay the position valued at several dates between now and expiry and the gaps between those lines are time decay, drawn rather than described.
Replay a past session minute by minute and watch a position behave before any money is at risk. The chain moves as it actually moved that day, and the basket is marked against it tick by tick.
Then push it: shift spot, shift implied volatility, roll the clock forward. Time decay stops being a number in a table and becomes something you watch happen to a curve.
Run a strategy across historical sessions and read what actually happened rather than what the idea sounded like. The equity curve is the headline; the drawdown underneath it is the part worth reading twice.
Results break down month by month, so a year that finished up is not allowed to hide the three months inside it that did not.
Delta, Gamma, Theta, Vega and Rho, computed per leg and for the whole basket from live prices, not a delayed snapshot and not a textbook example.
They are also plotted across spot, all four on one chart, because the relationship between them is the thing that matters: where gamma spikes is where delta turns over, and that is the strike a position gets run over at. Seen one at a time, that has to be held in your head across several clicks.
Ezi sits inside the app on every screen. Ask what an Iron Condor actually does, why theta hurts option buyers, what a high put-call ratio is telling you or how to read Max Pain, and get it back in plain language rather than a glossary entry.
It knows which instrument you are looking at, so questions do not have to be asked in the abstract. Ask about the chain in front of you and the answer is about that chain.
It explains, and only explains. Ezi cannot place a trade and will not tell you what to buy or sell. EzyOptions is an educational analytics platform, not an advisory service.
In-app chat on every screen
Strategies, Greeks and market terms in plain language
Implied volatility read as a shape instead of a column of numbers. Plotted across strikes, the same figures show which strikes are being paid up for. A steepening put skew is the market buying downside protection.
Calls and puts are drawn separately rather than averaged. Put-call parity says they should agree at the same strike, so where they visibly do not, one of them is not trading, and an average erases exactly that signal.
IV Rank and IV percentile place today's volatility against its own recent history, which is the context that decides whether an option is expensive or merely expensive-looking.
The whole market on one screen, so the context a position sits inside is somewhere you can look rather than something you assume.
Sector and index heat, advances against declines, India VIX and the day's movers: the readings that tell you whether a single strike's behaviour is about that strike or about everything at once.
Keep any basket you build and come back to it. Every saved strategy is re-priced against the live chain when you open the library, with its payoff, its current mark and its Greeks recomputed, so a strategy saved three weeks ago tells you where it stands now, not where it stood then.
Price alerts run alongside, in-app and by email, so a level you care about does not depend on you watching the screen when it prints.
The instruments you actually follow, in one list, carrying the numbers that decide whether one is worth opening: the last price, the day's move, and, for an index, the put-call ratio and the strike Max Pain currently sits on.
Keep more than one list. Indices in one, the stocks you trade in another, and a filter on each for when a list outgrows a glance.
Stocks are quoted from the front-month future and labelled FUT where that is what you are seeing: NSE cash is not on this data plan, and a number that does not say which market it came from is worse than no number.
Several lists, each filtered as it grows
Last traded price and the day's move per row
PCR and Max Pain beside every index
Stocks quoted from the front-month future, labelled FUT
Panel resizes to whatever share of the screen you want
Panes side by side, each holding its own view. Put one instrument in every pane to read the same market four ways, or put one view in every pane to read four indices the same way. Both arrangements are one click, because both are questions people actually ask.
Panes are dragged to swap, or moved with the arrow keys when one has focus, so the layout ends up in the order you think in rather than the order it opened in.
A comparison is a link. Copy it and the same panes, instruments and views open again, for you tomorrow, or for somebody you are explaining it to now.
Describe a strategy the way you would say it out loud: “short strangle on nifty, 30 delta, exit 15:10, 1% stop loss”. Back it comes as legs, entries, exits and the rules between them, laid out as a structure you can edit rather than a paragraph you cannot.
Stop-losses and re-entries are part of that structure, so the version you are looking at is the whole rule and not just the position it opens with.
Every version is kept. A rule you tried on Tuesday is still there on Friday, and any of them opens in the Strategy Builder to be finished by hand. It writes structures, not advice; what to do with one is your decision.
A sentence in plain English becomes legs and rules
Trade the live chain with nothing on it. The order pad takes the same legs the Builder does, fills come off the live bid and ask, and what you are left with behaves like a position: marked to market as the session moves, adjustable, rollable, squared off when you are done.
The book keeps the account, the open positions and the record of how they went, with the risk on the whole book shown as the worse of a one-per-cent move either way, IV held flat.
The spread you pay is real, because the quotes are. Brokerage, STT, exchange charges and slippage on size are not modelled, and every one of them makes a real result worse than the one on this screen.
Order pad on the live bid and ask, no broker
Positions marked to market through the session
Adjust the price or size, roll, or square off
Account, open positions and a performance record
Costs and slippage not modelled, so a real fill is worse
Publish a setup you like, and clone one you did not build. A shared strategy carries its legs rather than a picture of them, so a clone lands in your builder priced against the live chain instead of arriving as a screenshot to retype.
Upvotes and clone counts sit on every entry, which is the cheapest honest signal there is: how many people thought it was worth taking, not how loudly it was posted.
Direct messages are there for the part a library entry cannot hold: why the strike, why that expiry, what you would do if it moved against you.
Publish any strategy to the Strategy Library
Clone somebody else's, priced against the live chain