Pick a layout
One pane, two side by side, or four in a grid. Start from a ready-made layout or save your own, and copy a link to share the exact screen.
- Save up to twelve layouts
- Copy link and Reset
- Open any pane in its own window

Compare
Put one, two or four panes side by side, each with its own index and its own view, from a price chart to a chain heatmap. A Stocks tab lines up to six stocks against an index.
New here? Start free, no card needed.
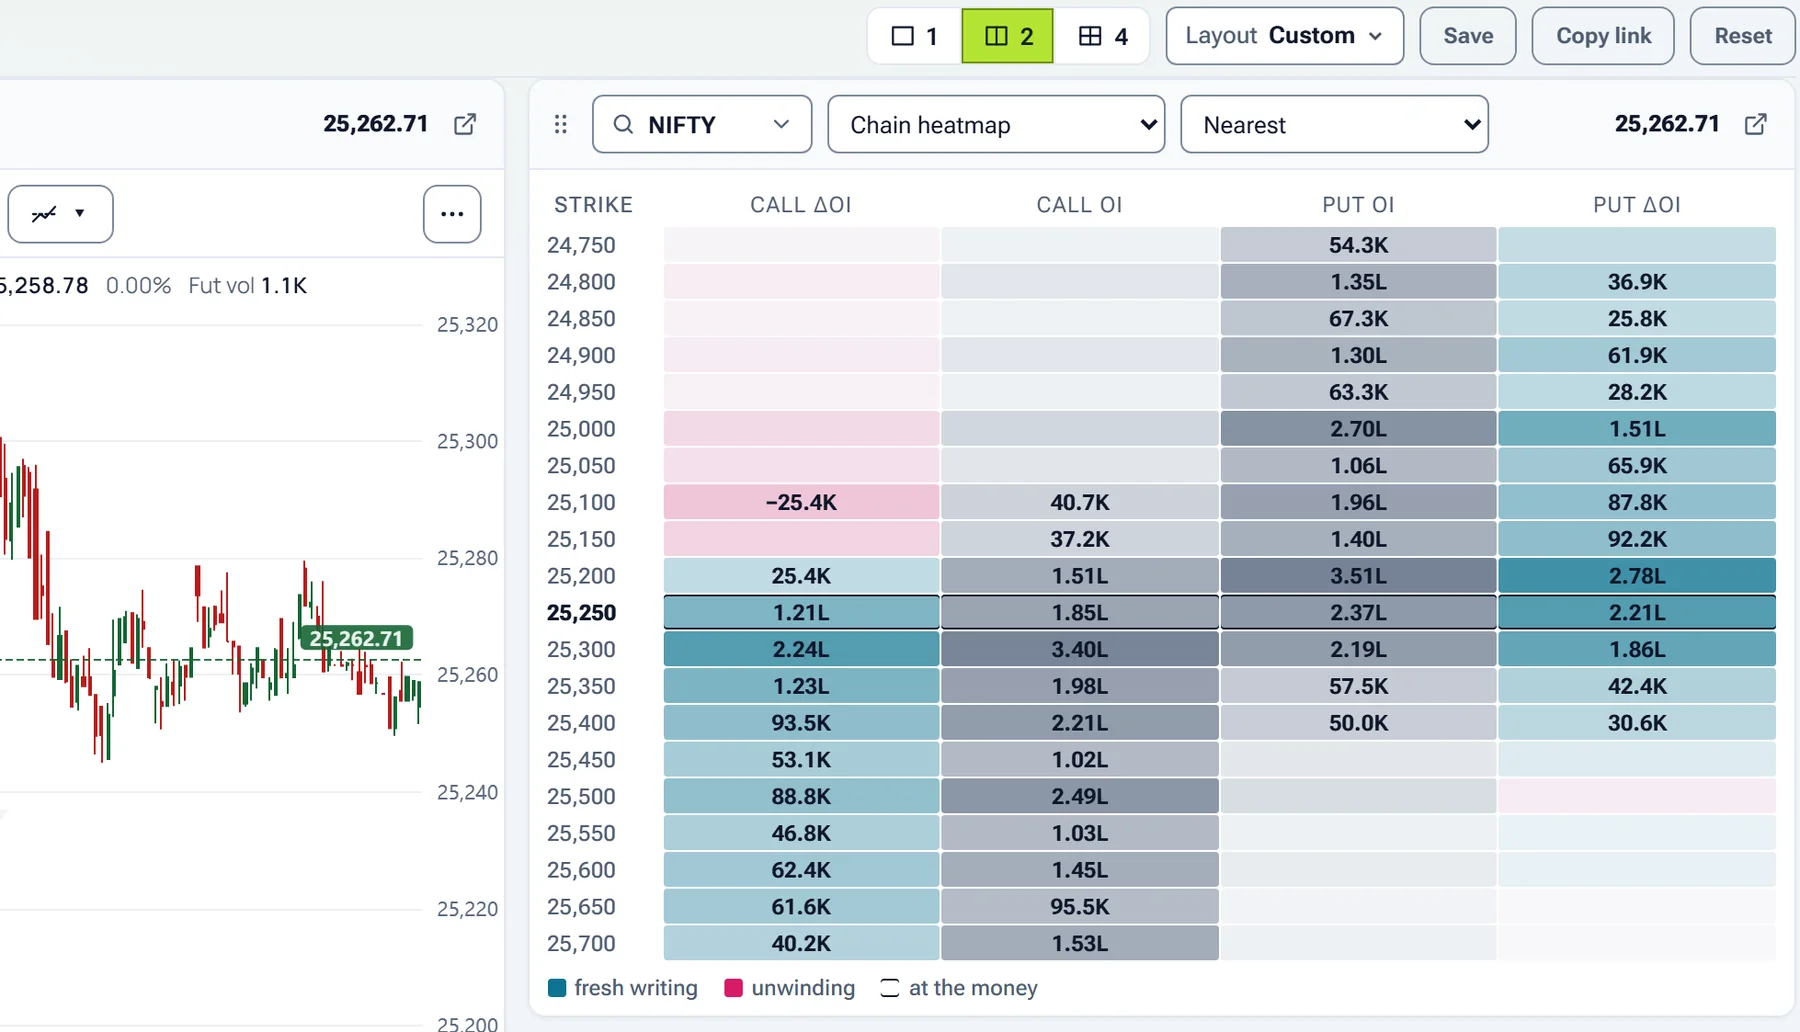
Choose a layout, then give each pane a symbol and a view. Save the layout to come back to it.
One pane, two side by side, or four in a grid. Start from a ready-made layout or save your own, and copy a link to share the exact screen.
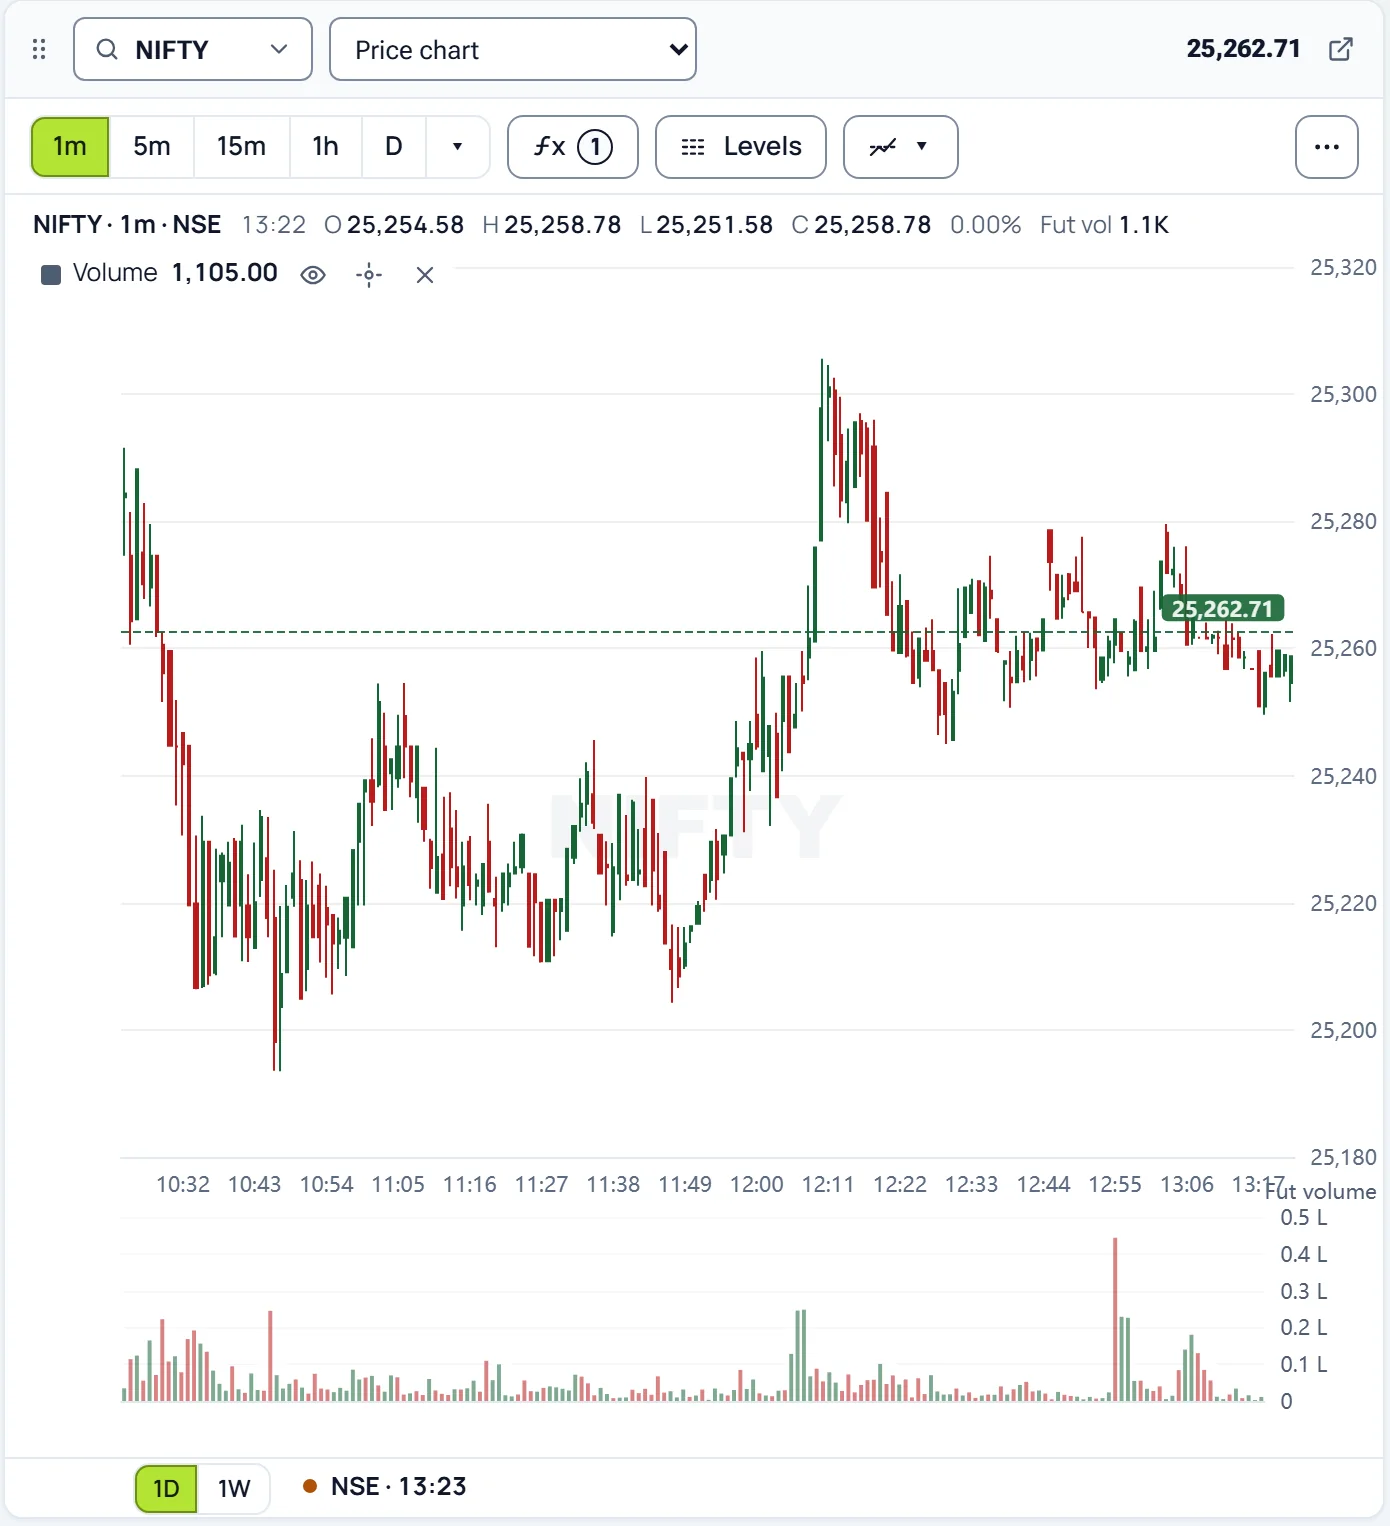
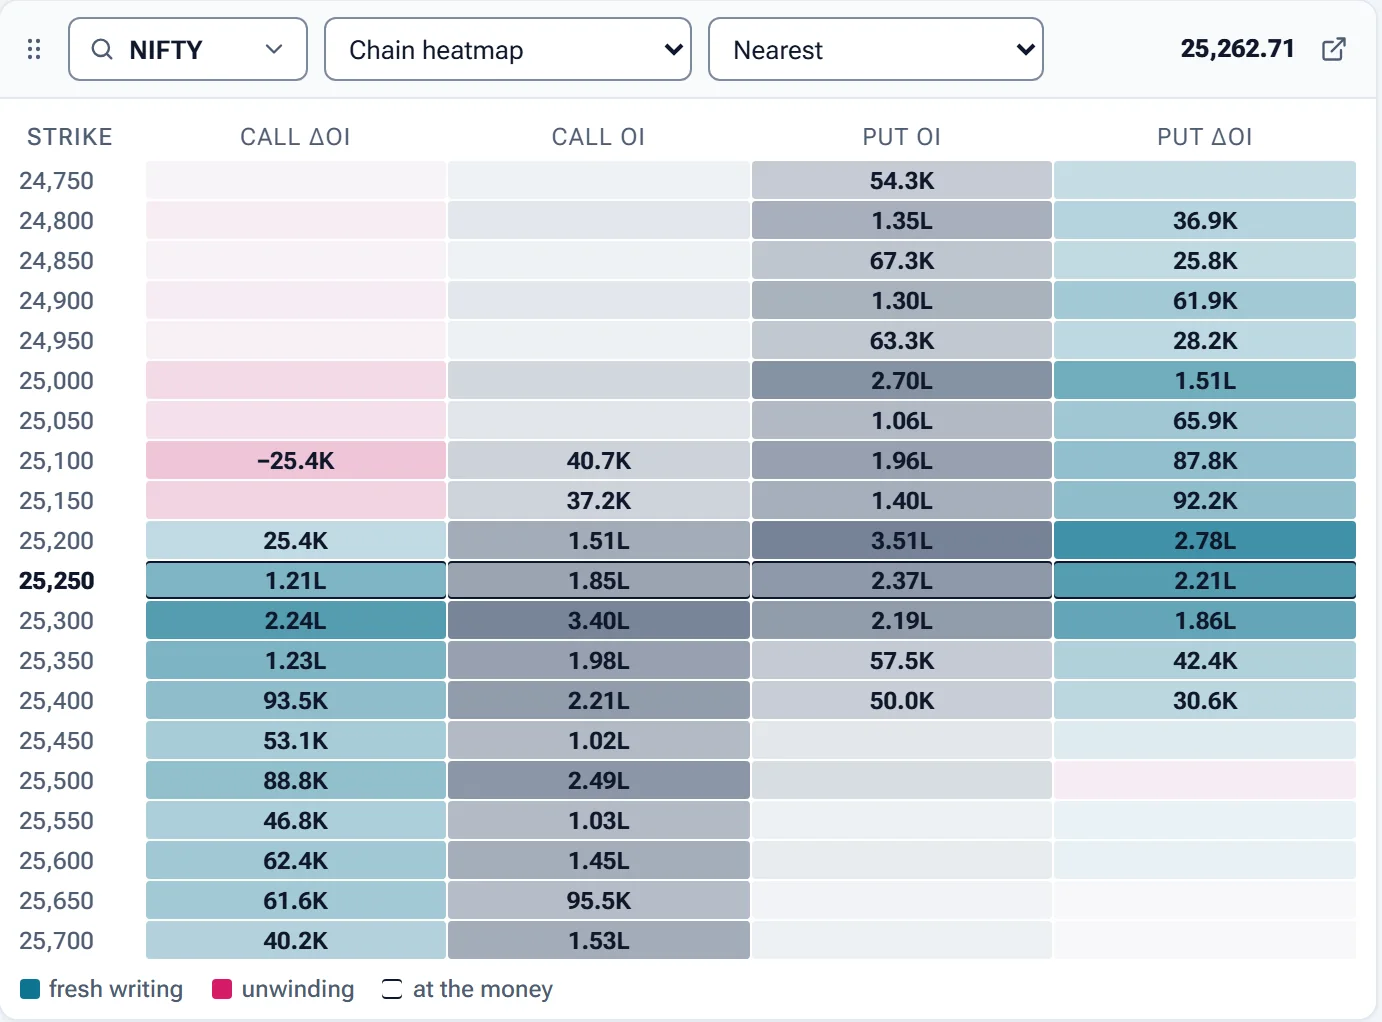
A pane can be a price chart, chain heatmap, strike walls, IV skew, IV term structure, VWAP with volume, straddle premium, OI decay, OI change by strike, or PCR, Max Pain and ATM IV through the day.
The chain heatmap shades call and put OI and OI change by strike, so fresh writing and unwinding stand out, with the at-the-money strike outlined.
Up to six stocks against an index or sector index, on one chart rebased to percent.
The Stocks tab puts a table of price figures and options figures beside the chart.
For example NIFTY's IV skew beside BANKNIFTY's, each pane on its own symbol.
Every pane is NSE data, 15 minutes delayed, with the time it was read.
NSE data, 15 minutes delayed. Analytics, not advice.
Educational analytics only: not investment advice. You are responsible for your own trading decisions.