Flows and the rupee: FII cash flow against USD/INR
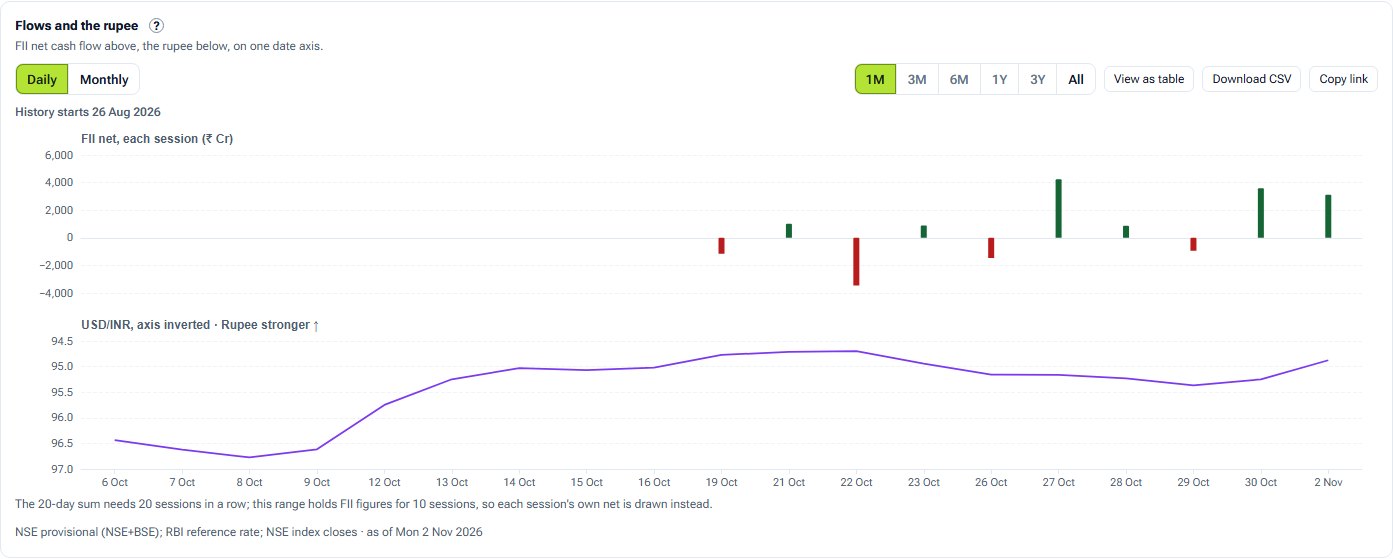
Foreign money comes in and goes out through the rupee. This chart puts FII cash flow and USD/INR on one date axis.
- What it is
- FII net cash flow in a top panel and USD/INR below it, on one date axis.
- Data it uses
- NSE's provisional FII/DII cash-market report: buy, sell and net in ₹ crore for each session. RBI's USD/INR reference rate.
- Covers
- FII cash flow (Combined or NSE only) and the US dollar against the rupee
- Updates
- Each trading day for flows; each RBI business day for the rate
What the chart shows
- Top panel, Daily: each bar is the sum of the last 20 sessions of FII net cash flow. Monthly: each bar is a calendar month's total.
- Bottom panel: RBI's USD/INR reference rate, its axis turned upside down so a stronger rupee (fewer rupees to the dollar) sits higher.
- Green bars are net buying, red net selling. Hover a date for both figures.
How it is worked out
The 20-session sum adds the last 20 sessions' FII nets in ₹ crore. RBI publishes no reference rate table from 24 Jul 2018 to 12 Apr 2022, so that stretch is drawn as a grey band rather than a line.
How to read it
Look for stretches where sustained buying or selling lines up with the rupee firming or weakening, and for ones where it does not.
Controls
- Granularity: Daily (20-session sum) or Monthly
- Range: 1 month to all the history held
- Report: Combined (NSE+BSE) or NSE only
- View as table
Keep in mind
Two series on one date axis, not a cause and its effect. Many things move the rupee besides equity flows.
Flows and the rupee questions
Why is the USD/INR axis upside down?
So that a stronger rupee, fewer rupees to the dollar, sits higher, the same way up as net buying in the panel above.
Why is there a grey band?
RBI's reference rate table has no figures from 24 Jul 2018 to 12 Apr 2022, so that stretch is marked rather than drawn as a line.
Related tools and guides
Daily net flow
FII and DII net buying and selling in the Indian cash market for each session, from NSE's provisional report, with 5, 20 and 60-session rolling sums.
Sector flows
FPI equity net investment by sector from NSDL's fortnightly report: bought to the right, sold to the left, as bars, a flow map or holdings, for the latest fortnight or a longer window.
Cumulative flows
FII and DII running totals of net cash-market flow, restarting each month, quarter, financial year, calendar year or from dates you pick.
All FII/DII charts
Every FII/DII chart with a screenshot and what it tells you.
Educational analytics only: not investment advice. You are responsible for your own trading decisions.