Session Analysis

Replay a past day and trade it minute by minute.

Session Analysis replays a recorded NSE trading day minute by minute: the option chain shows that day's prices at the minute you are on, so you can take a position and watch its P&L, premiums and time decay through a real session. No order is placed and nothing is at risk.

New here? Start free, no card needed.

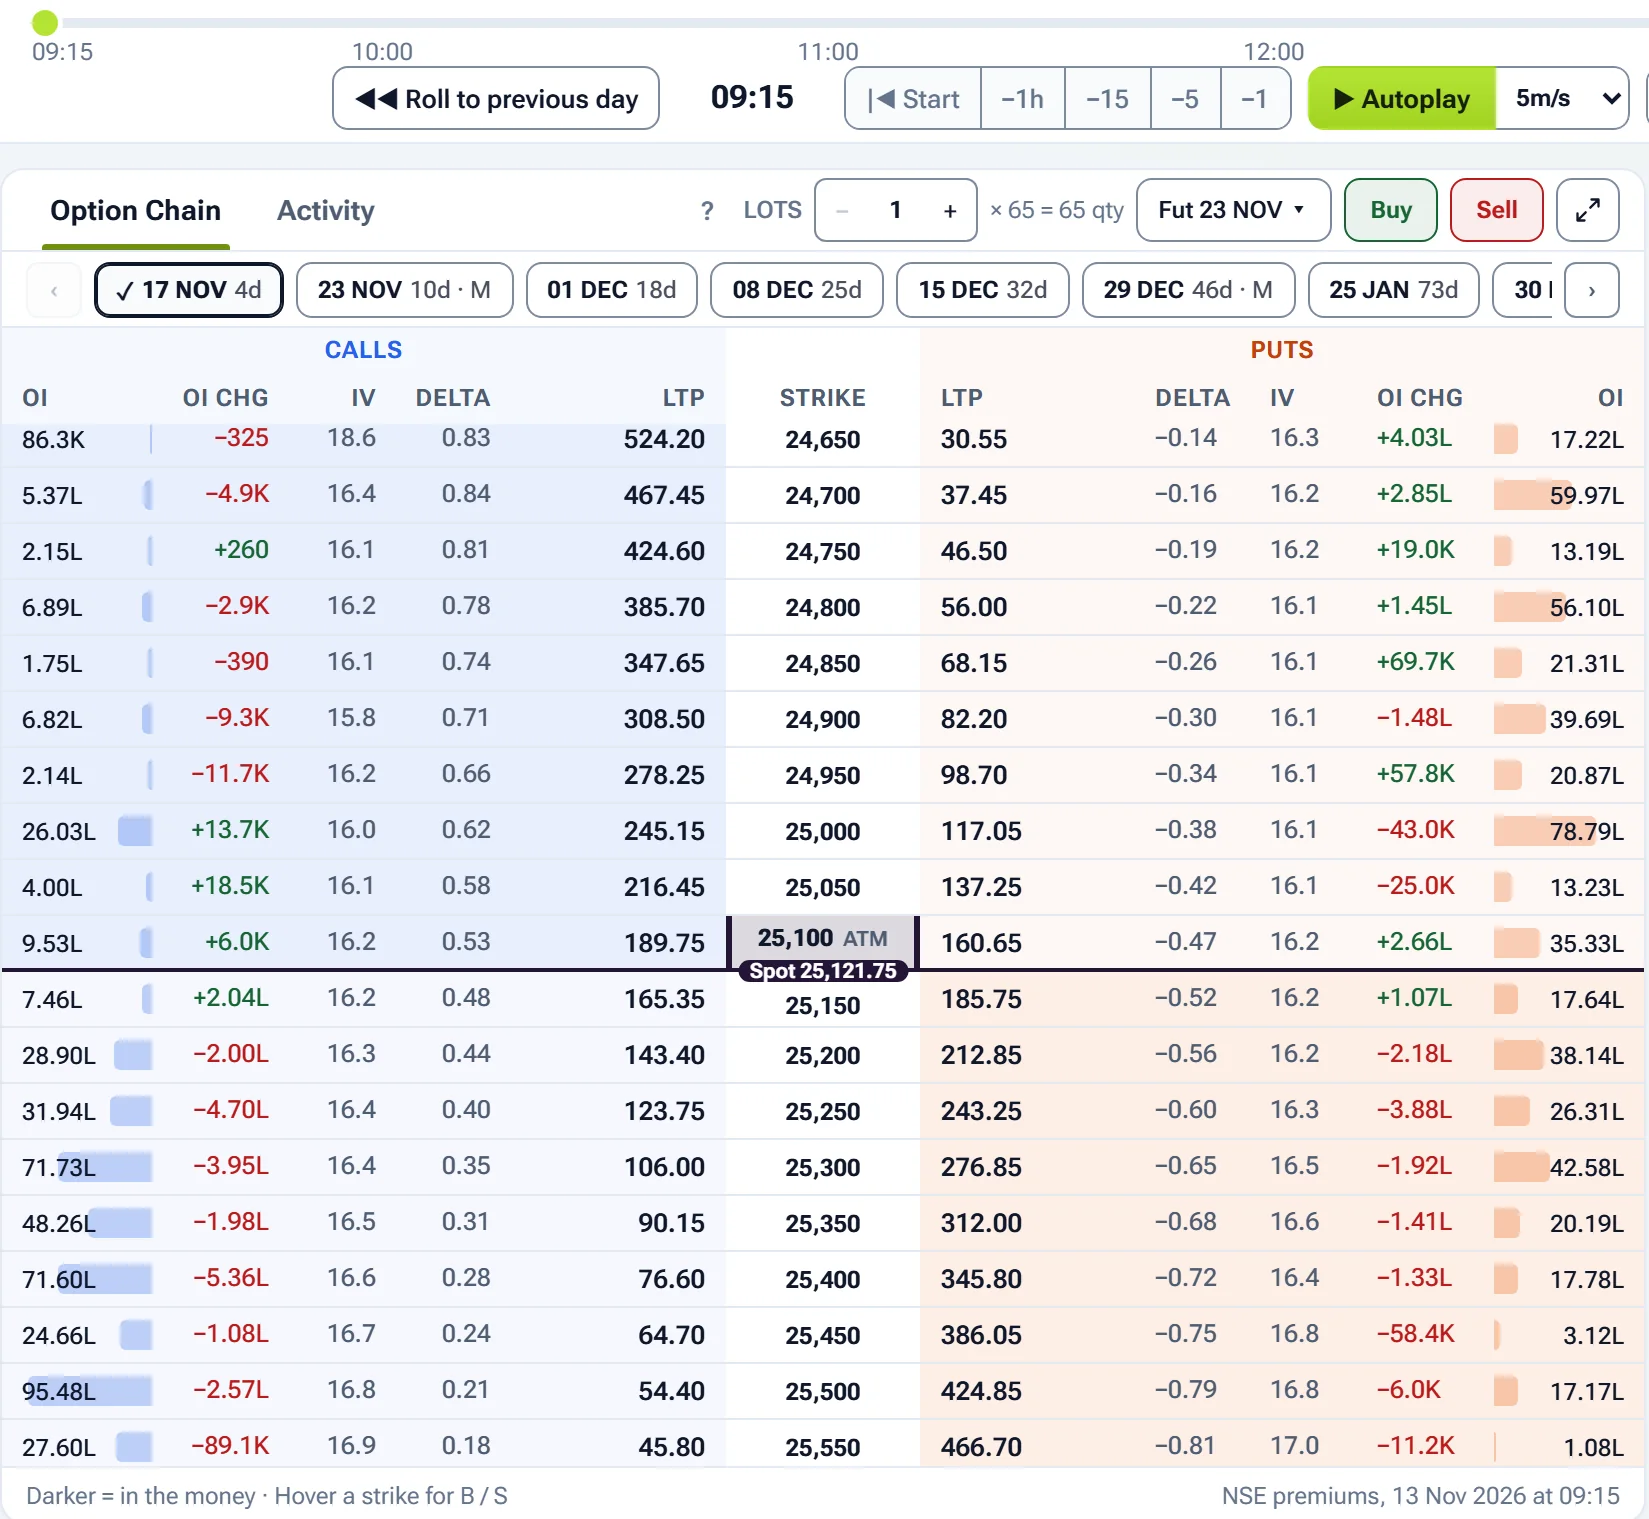
Prices as they were that minuteNIFTY session of 13 Nov 2026 loaded at 09:15: the replay timeline with step buttons and Autoplay, and the option chain with OI, IV, delta and premiums at that minuteActivity rows: a sold call, a bought put and a closed put, each with entry, current price, P&L and start time

Five things you do in a replay

Pick a day, trade it, set your exits, let the clock run, and carry the position into the next session if you want.

Pick a day and move the clock

Choose a date and an index and press Load. Step by 1, 5 or 15 minutes or an hour, drag the timeline, or press Autoplay and pick its speed.

  • Start, End and Reset day
  • Roll to the previous day in one click
  • Spot, future, straddle and PCR at that minute
Replay strip at 10:47 on 6 Nov 2026, with step buttons, Autoplay at 5 minutes a second and Reset day

Trade from the chain at that minute

Hover a strike and press Buy or Sell, or trade the future from the chain header. The leg enters at the replayed minute's price.

  • Any listed expiry, weekly or monthly
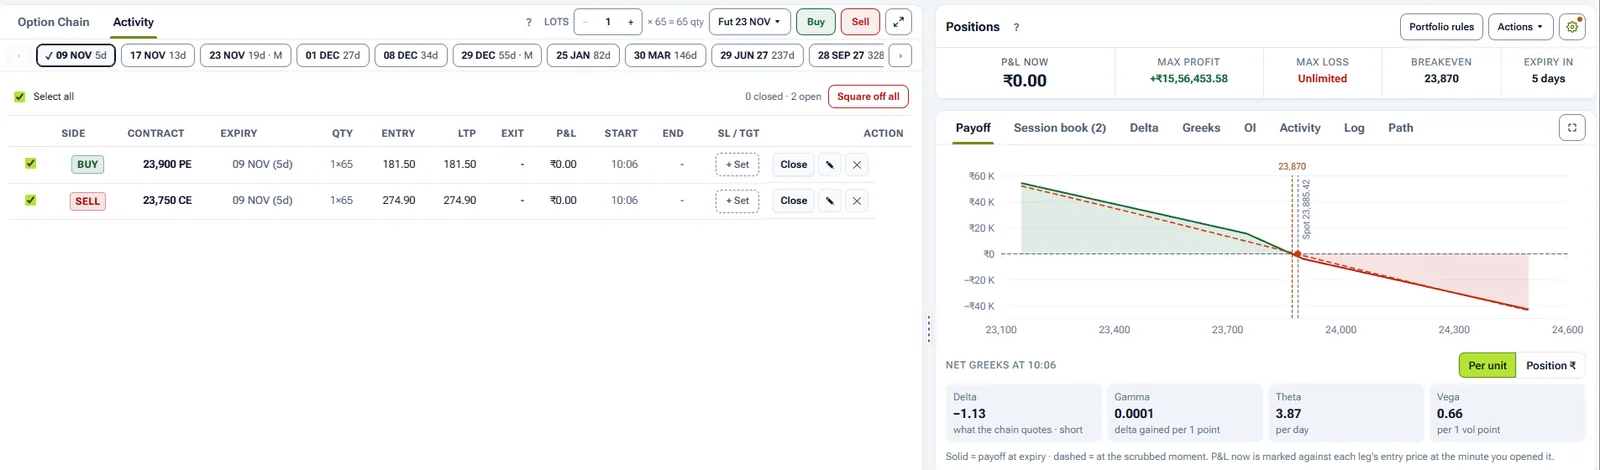
  • Payoff, P&L now, max profit and loss, breakeven
  • Net Greeks at the minute you are on
Two legs opened at 10:06 with the payoff chart, max profit, max loss, breakeven and net Greeks at 10:06

Set a stop loss and target per leg

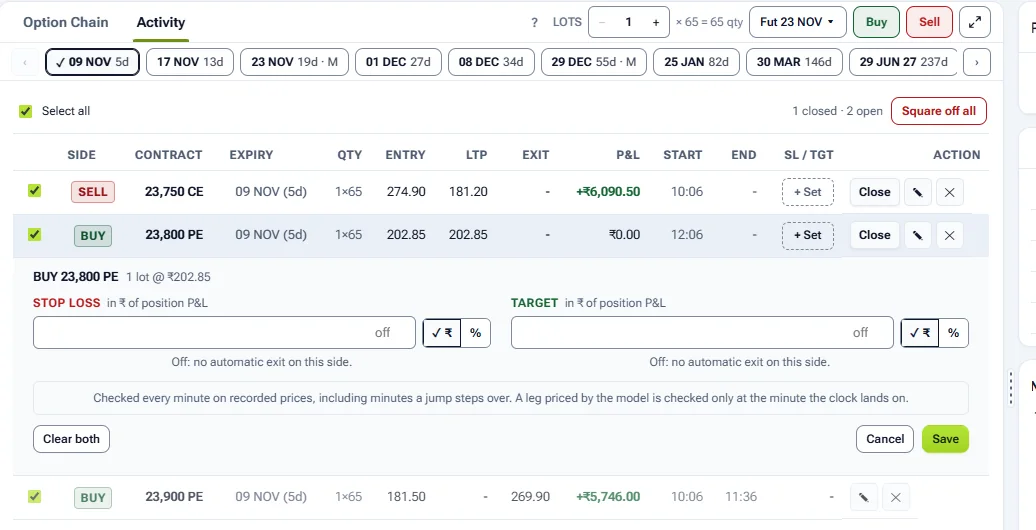
Press + Set on a leg and give a stop and a target in rupees or percent. They are checked every minute on recorded prices.

  • Rupees or percent of the position's P&L
  • Off on either side means no automatic exit
  • Portfolio rules act on the whole book
Stop loss and target editor for a bought put, in rupees or percent, with the note that exits are checked every minute on recorded prices

Watch the rules fire

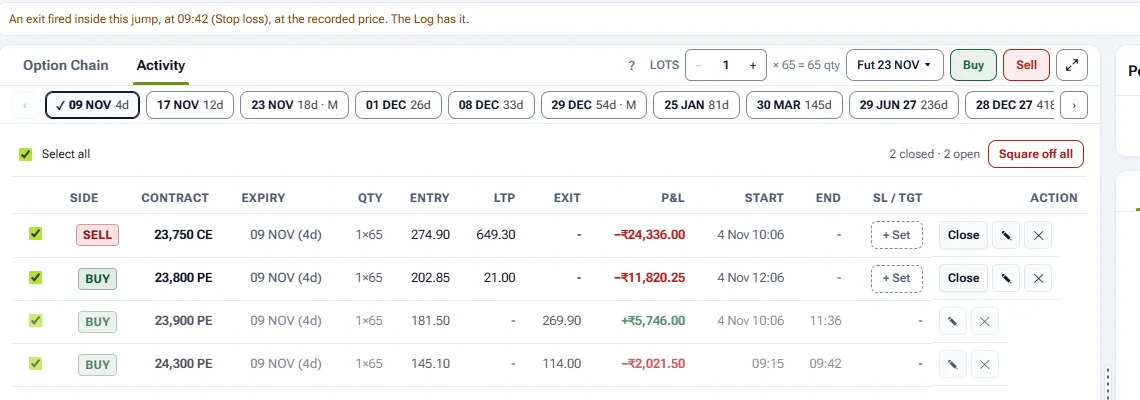
Jump ahead and any exit that fell inside the jump is booked at the minute it fired, at the recorded price, and written to the Log.

  • Closed legs keep their exit and P&L
  • Session book and Log tabs list every action
Notice that an exit fired inside the jump at 09:42 on its stop loss, with the closed leg's exit price and loss in the Activity table

Carry it to the next day

Roll to next day takes the open legs into the following session, marked from where they were. The Log keeps the dates.

  • Send the legs to the Builder
  • Download a CSV or copy a share link
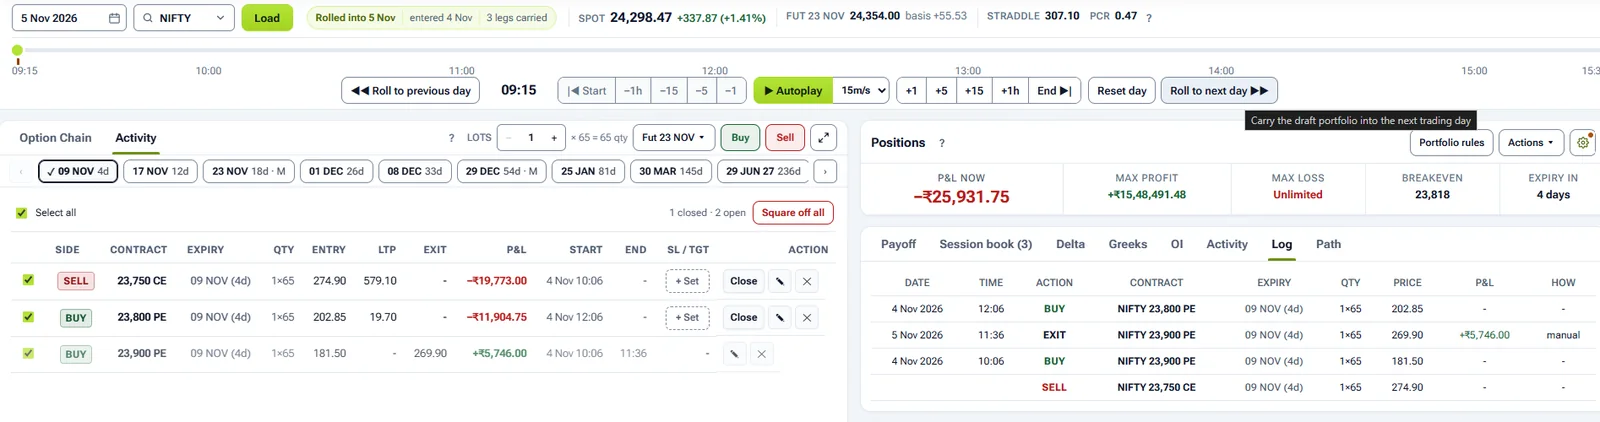
Session rolled into 5 Nov with 3 legs carried from 4 Nov, P&L now, and the Log listing each buy and exit with its date and time

What you see at every minute

Payoff now and at expiry

The curve at expiry and at the replayed moment, with breakeven and spot marked.

Net Greeks at that minute

Delta, gamma, theta and vega of the whole position, per unit or in rupees.

Every leg and every exit

Entry, current price, exit, P&L, start and end time for each leg, open or closed.

The index chart so far

1, 5 or 15 minute bars up to the replayed minute, never past it.

Open Session Analysis on today's data

NSE data, 15 minutes delayed. Analytics, not advice.

Open Session Analysis

Session Analysis: replay real NSE sessions minute by minute

Step through past NSE sessions minute by minute and watch a position behave before any money is at risk.

What is Session Analysis?

Pick a recorded session and play it forward. The option chain moves as it moved that day, minute by minute, and your basket is marked against it as it goes. A straddle through a quiet expiry morning and the same straddle through a trending afternoon teach two different lessons, and Session Analysis lets you sit through both.

How do I study a position in a replay?

Shift the spot and watch delta and gamma do their work. Shift implied volatility and watch vega reprice every leg, the crush after an event or the expansion before one. Roll the clock forward and theta stops being a number in a table and becomes something you watch happen to a curve, day by day, against the expiry payoff.

How is it different from Draft Portfolio?

Session Analysis looks at the past; Draft Portfolio looks at the present. Positions are drafted against live market prices and marked to market as the session moves. No order reaches an exchange and no broker account is linked, so a strategy from the builder can be studied on a recorded session and then followed on a live one.

Why use recorded sessions rather than made-up prices?

Made-up candles teach made-up lessons. The sessions here are recorded market data, with the chain, the premiums and the decay of that actual day, which is what makes the rehearsal honest. The basics guide explains the concepts; Session Analysis is where you watch them play out.

Session Analysis questions

What is Session Analysis?

A tool that replays recorded market sessions minute by minute so you can watch an option position behave through a real day: premiums moving, time value decaying, the payoff curve shifting. It is analysis of what actually happened, with nothing at risk.

Can I study a position without placing an order?

Yes, two ways. Session Analysis replays recorded past sessions so you can follow a position through a real day. Draft Portfolio holds drafted positions against live prices during market hours. Neither places an order, and neither needs a broker account, linking or money.

How is Session Analysis different from a backtester?

Session Analysis is one session watched unfold minute by minute, built for understanding how a position behaves. The backtester runs a strategy across many historical sessions and reports the equity curve, drawdown and month-by-month results. EzyOptions includes both.

Start free

Educational analytics only: not investment advice. You are responsible for your own trading decisions.