Change in OI: where open interest was added and cut today
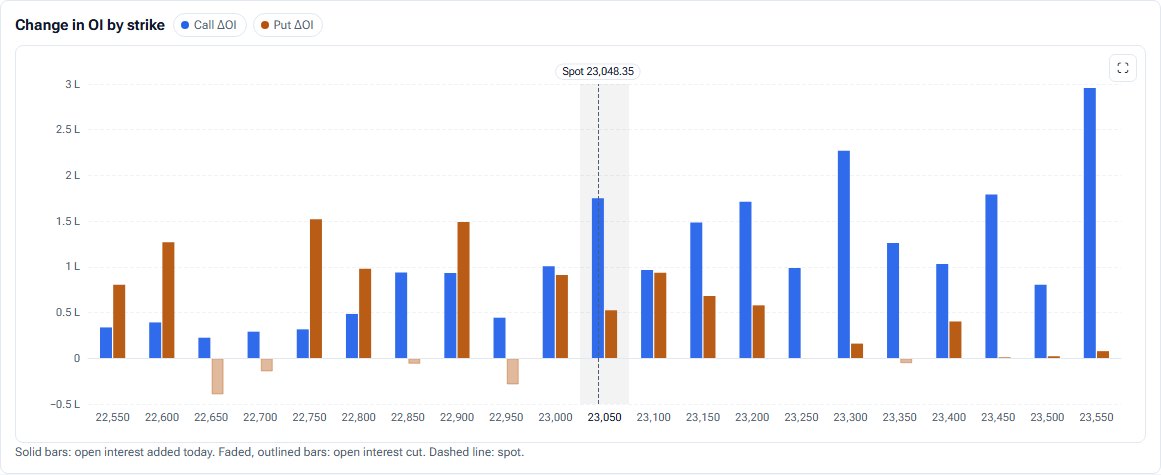
Open interest tells you where positions sit; the change tells you what traders did today. This chart shows calls and puts added and cut at every strike since the session opened.
- What it is
- A bar chart of how much call and put open interest was added or cut at each strike today.
- Data it uses
- NSE option chain: open interest now against the session's first reading; the chain 15, 30 or 60 minutes earlier for the window.
- Covers
- NIFTY, BANKNIFTY, FINNIFTY, MIDCPNIFTY and NIFTY NEXT 50
- Updates
- Through the session as NSE's data arrives (15 minutes delayed); past sessions can be opened, and today can be replayed minute by minute
What the chart shows
- Signed bars by strike, call change in blue and put change in orange. Solid bars are OI added today; faded, outlined bars are OI cut.
- A window panel rebuilds the same chain 15, 30 or 60 minutes earlier, so you can see what changed in the last stretch of the session rather than since the open.
- Cards show call and put change, the net (put minus call), the change-in-OI PCR, and how many legs are in short build-up and short covering. Under More detail: the five biggest additions and cuts, and today's OI trend.
How it is worked out
Change in OI is measured from the session's first reading. ΔOI PCR is put OI added divided by call OI added, and is left blank when either side shed OI, because a ratio of a gain to a loss means nothing.
How to read it
Heavy call additions at a strike mean calls are being written there: a ceiling forming. Heavy put additions below spot mean put writing: a floor. The window panel tells you whether that happened this morning or is happening now.
Controls
- Session: today, or a stored past session
- Expiries: one or several
- Strikes: around the money, or a custom range
- Window: 15, 30 or 60 minutes
- Replay: any minute of today's session
Keep in mind
The window rebuilds one expiry at a time, and the intraday OI trend follows the page's expiry rather than the filters.
Change in OI questions
What does a rise in put OI mean?
More put contracts are open than at the start of the day. Paired with a falling put price it usually means writing (a short build-up); with a rising price, buying. The strike table names the buildup for each leg.
How is this different from OI by Strike?
OI by Strike shows everything open now, including positions from weeks ago. Change in OI shows only what was added or cut today, which is where the day's activity is.
Can I see the change for the last half hour only?
Yes. The window panel compares the chain now with the chain 15, 30 or 60 minutes earlier.
Related tools and guides
OI by Strike
Call and put open interest at every strike, with call and put walls, max pain and spot marked. Sum several expiries, show today's change, and replay the session.
OI × time
A strike-by-time heat map of open interest added since 09:15, for calls, puts or puts minus calls, plus the call and put walls minute by minute.
Futures buildup
The index future against its VWAP, and open interest added in each bucket coloured as long buildup, short buildup, short covering or long unwinding.
All Pulse charts
Every chart in Pulse with a screenshot and what it tells you.
Educational analytics only: not investment advice. You are responsible for your own trading decisions.