F&O Analytics (Pulse)

Where open interest sits, and how it moved today

Pick an index or F&O stock and an expiry. Pulse reads its option chain into support, resistance, expected move, PCR and buildup, with more than 35 sections to dig into. NSE data, 15 minutes delayed.

New here? Start free, no card needed.

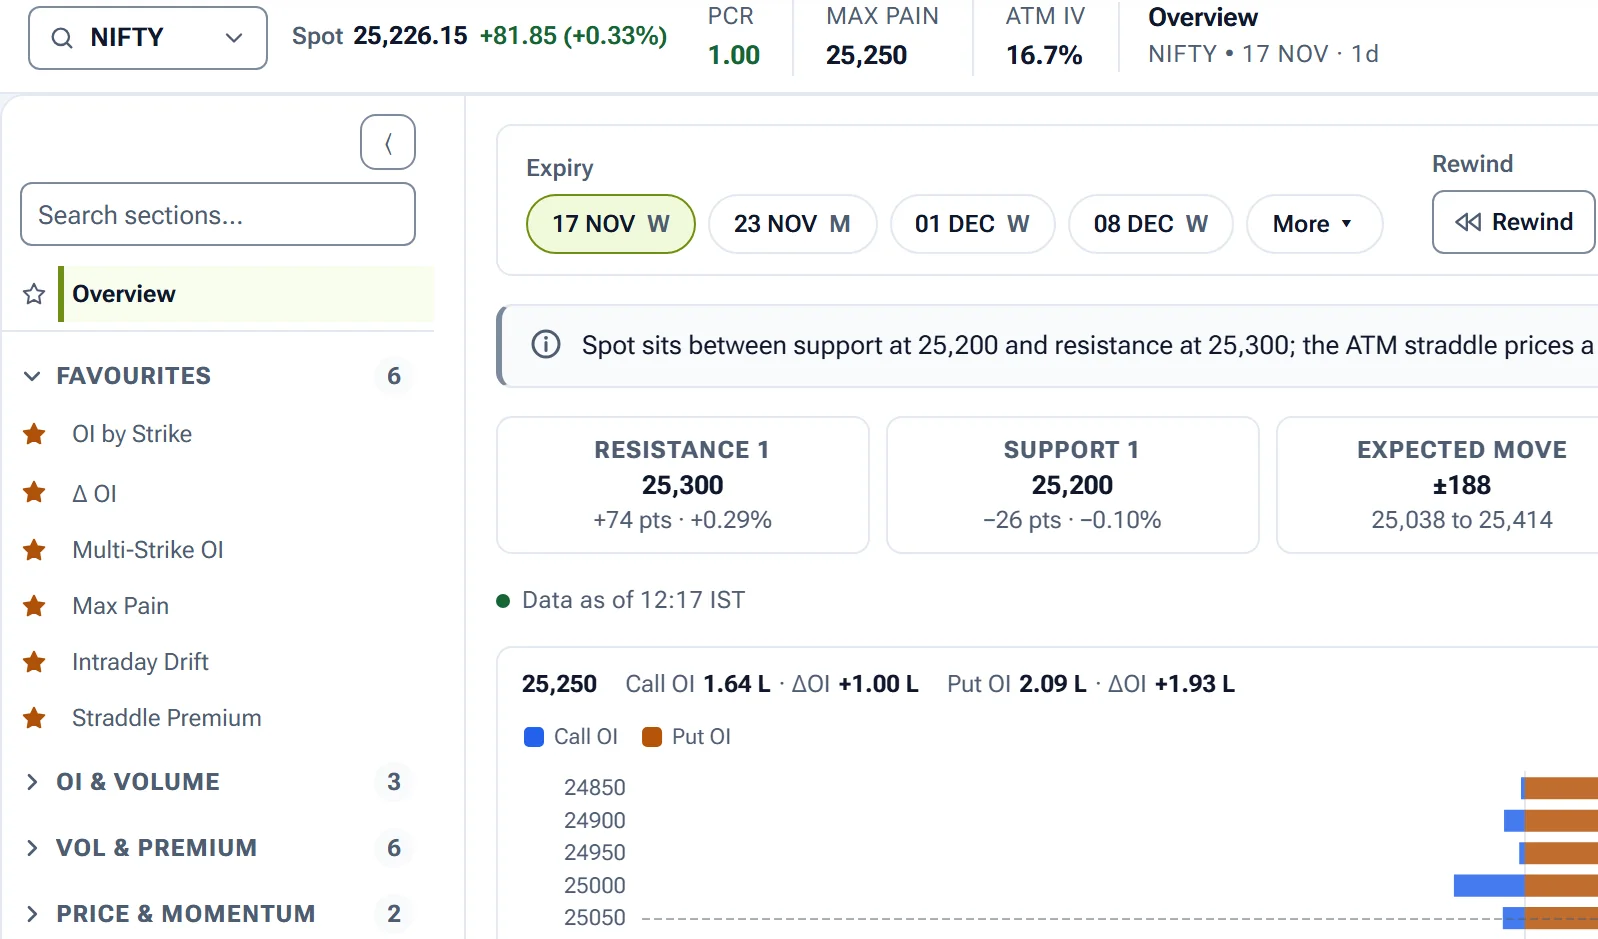
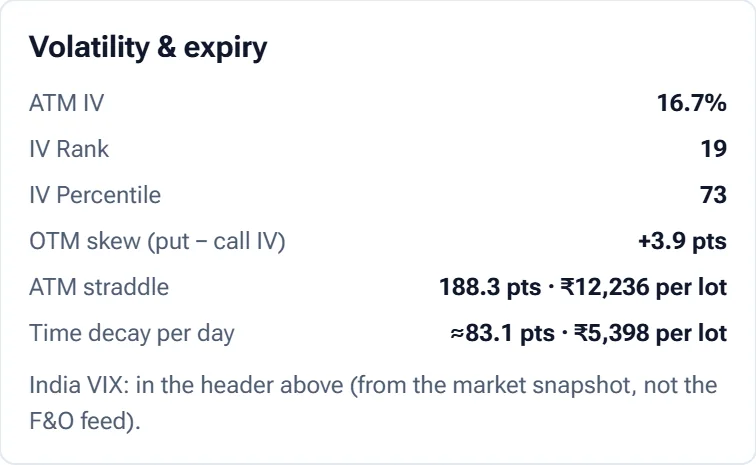
Every section names its timePulse for NIFTY: the section list on the left, expiry chips and Rewind, a one-line reading and six headline tilesVolatility and expiry card with ATM IV, IV rank, IV percentile, OTM skew, ATM straddle and time decay per day

How you read a chain in Pulse

One symbol and one expiry at the top drive every section. Change either and the whole page follows.

See the walls on one chart

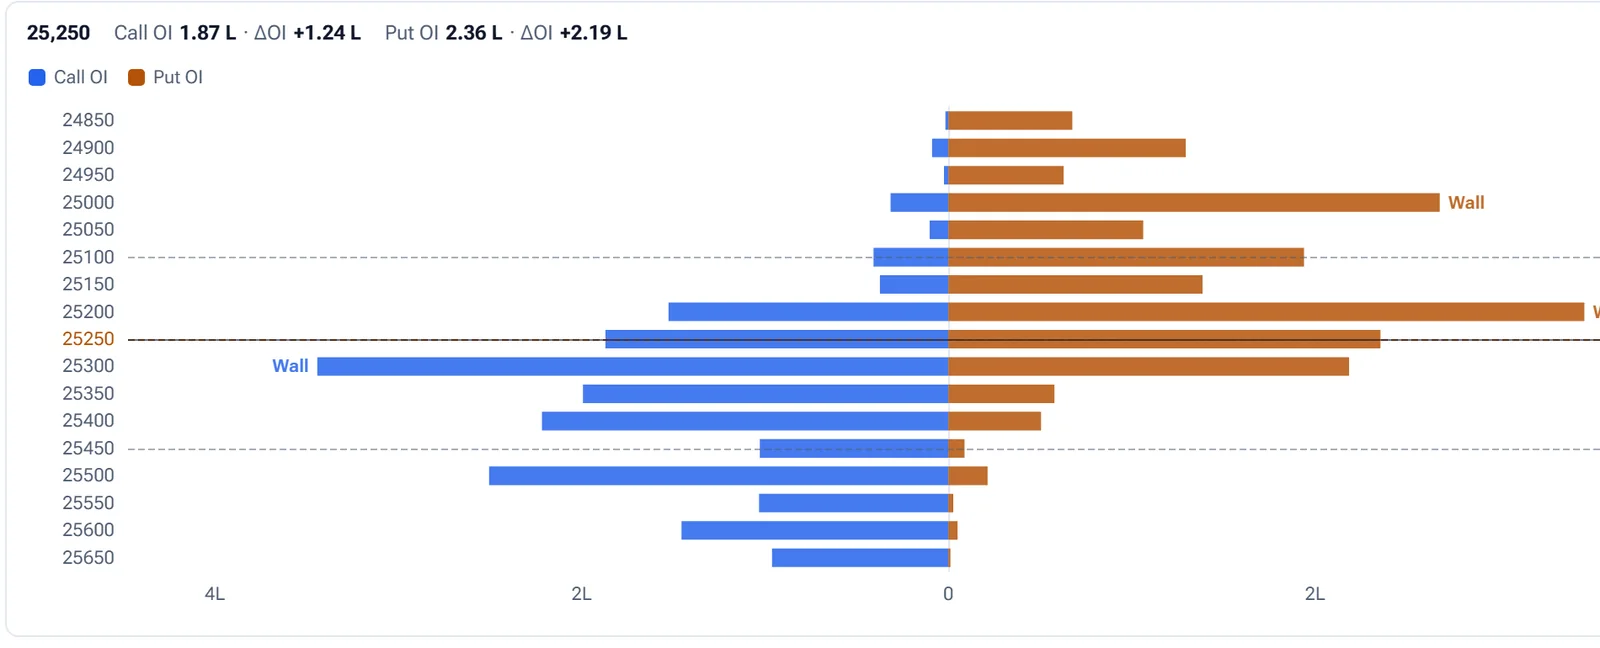
OI by Strike draws call and put open interest side by side around spot. The biggest strikes are marked as walls, with spot, max pain and the range the ATM straddle prices in drawn across.

  • Hover a strike for its OI and change in OI
  • Dashed edges: the straddle's expected range
  • Open full screen for a bigger chart
OI by Strike bar chart for NIFTY with call OI in blue, put OI in orange, walls labelled and the spot line

Start from the overview

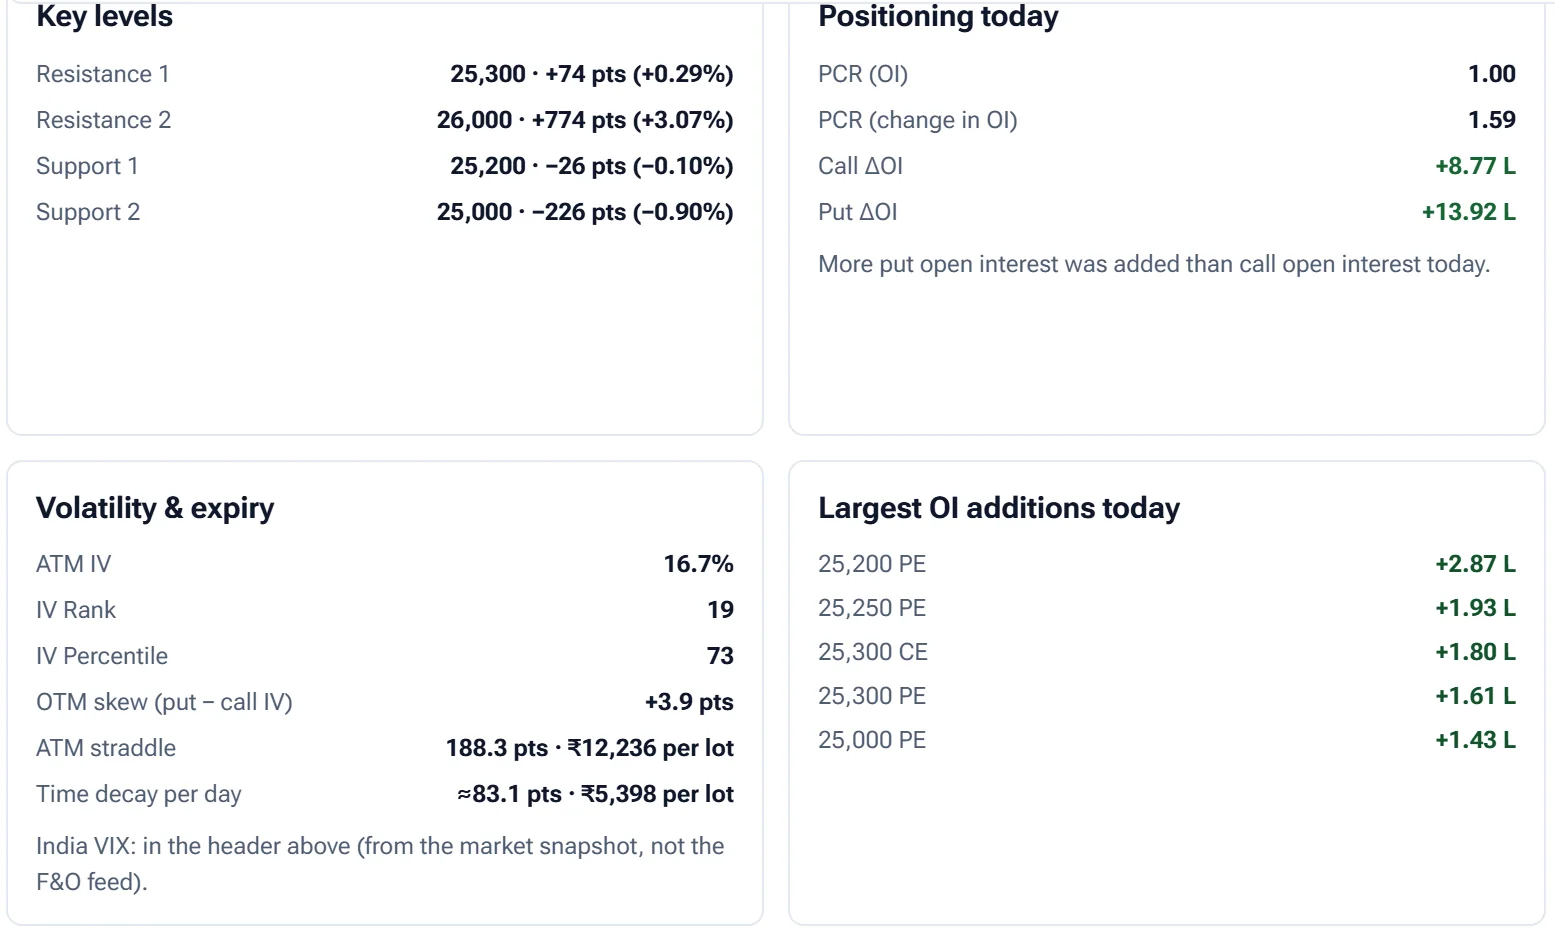
The Overview turns the chain into plain readings: resistance and support levels, PCR on OI and on change in OI, the near-month future's basis and buildup, and the strikes where OI was added or cut most today.

  • A one-line summary at the top
  • Levels with distance from spot in points and %
  • Time decay per day in points and per lot
Overview cards: key levels, positioning today, volatility and expiry, and the largest OI additions

Open the section you need

Sections sit in groups down the left: OI and volume, volatility and premium, price, futures, liquidity, the broader market, stock F&O and heat maps. Star the ones you use and they stay at the top.

  • Max pain, PCR history, IV skew, straddle premium
  • Gamma and delta exposure, futures curve, rollover
  • Stock movers, buildup radar, OI walls, heat maps
Overview tiles for PCR history, max pain, IV skew and straddle premium, each with an Open section link

Also on every Pulse page

Rewind the session

Move a slider back through today and the OI, max pain and exposure charts redraw as they stood then.

Ask EzyAI

Ask about what the page shows. It explains the readings; it does not give buy or sell calls.

Alert from the strip

Alert in the header offers PCR crossing a level, max pain moving or ATM IV crossing a level.

Positioning, not direction

Max pain and PCR come from the chain and describe how traders are positioned, not where price goes.

Open Pulse on today's data

NSE data, 15 minutes delayed. Analytics, not advice.

Open Pulse

Start free

Educational analytics only: not investment advice. You are responsible for your own trading decisions.