Market Breadth: advancing and declining F&O stocks by session
Is a rally broad or narrow? Breadth counts how many F&O stocks rose and fell in each session, so you can see when an index move is carried by a handful of names.
- What it is
- A stacked bar per session showing the share of F&O stocks that rose, fell or stayed flat.
- Data it uses
- Every F&O stock's near-month future: last price against NSE's previous settlement price. About 210 stocks; index futures excluded.
- Covers
- NSE F&O stocks
- Updates
- Today refreshes every minute; one stored session is added each evening (13, 20 or 40 shown)
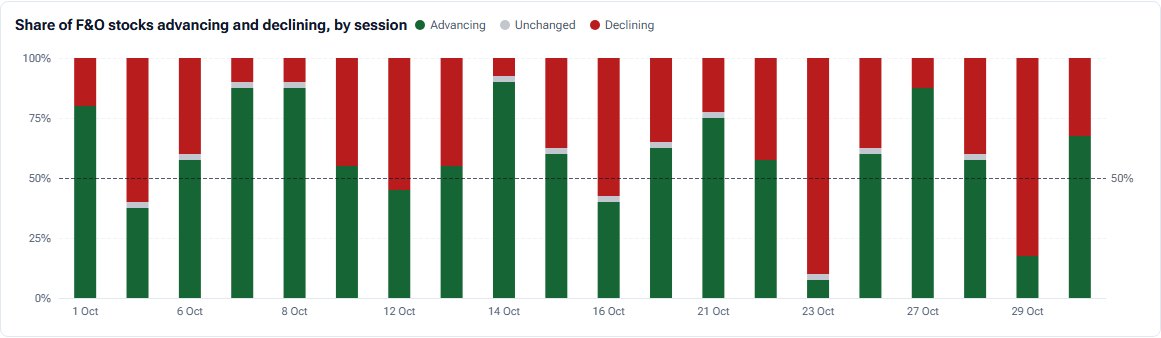
What the chart shows
- One 100% bar per session: advancing in green, unchanged in grey, declining in red, with a dashed 50% line.
- Under More detail: today's bar, the advance-decline ratio by session, and a table with up and down counts, the average move and long and short buildup counts.
- Cards: today's A/D ratio, the number of sessions shown, and the broadest rise and fall.
How it is worked out
Each F&O stock (about 210) is counted by its near-month future's last price against NSE's previous settlement price. Index futures are left out. The A/D ratio is advancing divided by declining.
How to read it
Green past the 50% line means more than half the names rose. An index that keeps rising while decliners lead is a narrowing rally.
Controls
- Sessions: 13, 20 or 40
Keep in mind
Breadth counts stocks, not their weight in any index, and it covers F&O stocks only, not the whole market. A new row is added each evening once the session is stored.
Market Breadth questions
What is the advance-decline ratio?
The number of stocks that rose divided by the number that fell. Above 1 means more rose.
Which stocks are counted?
NSE's F&O stocks, roughly 210, each by its near-month future.
Is it weighted by market cap?
No. Every stock counts once.
Related tools and guides
Buildup Radar
Every F&O stock's future plotted by price change against OI change: long buildup, short buildup, short covering and long unwinding at a glance.
Heat maps
Twelve heat maps of NSE F&O: stock and sector moves, OI change, buildup, IV, VWAP, rollover, strike by expiry grids and the last week.
Unusual activity
Index and stock options trading far heavier than their neighbouring strikes, ranked by volume against open interest, plus one-minute volume bursts.
All Pulse charts
Every chart in Pulse with a screenshot and what it tells you.
Educational analytics only: not investment advice. You are responsible for your own trading decisions.