Flows vs NIFTY: FII and DII cash flow against the index
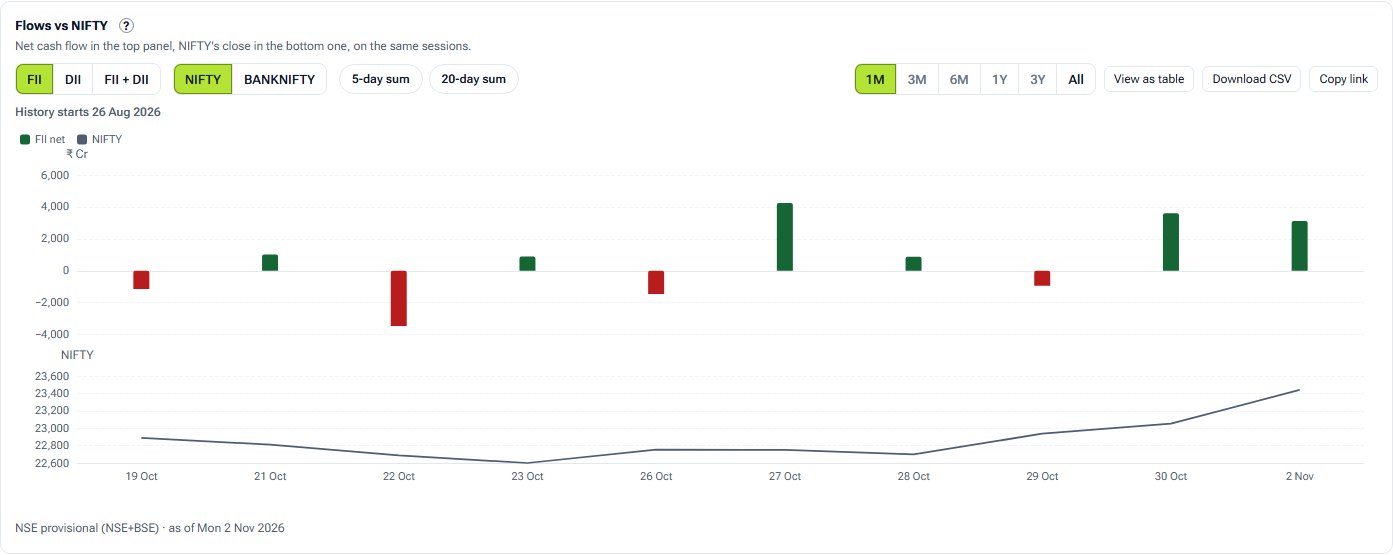
Institutional flow and the index on the same sessions, drawn as two panels that share a date axis rather than two scales on one chart.
- What it is
- Net cash flow in a top panel and the index's close in a bottom one, on the same sessions.
- Data it uses
- NSE's provisional FII/DII cash-market report: buy, sell and net in ₹ crore for each session. NIFTY and BANKNIFTY closing levels.
- Covers
- Combined NSE, BSE and MSEI trades (the default), or NSE alone
- Updates
- Each trading day, from NSE's evening report (read between 18:30 and 21:30 IST); NSE may revise a provisional figure
What the chart shows
- Top panel: the chosen side's net flow in ₹ crore, green buying and red selling.
- Bottom panel: NIFTY's or BANKNIFTY's closing level.
- Optional 5 and 20-session rolling sums on the flow panel. Hover or zoom one panel and the other follows.
How it is worked out
The flow is NSE's daily net in ₹ crore; FII + DII adds the two. A rolling sum adds that many sessions' nets and stays empty until that many sessions are held.
How to read it
Look for stretches where flow and the index move together or apart; one day on its own says little. The two are drawn apart on purpose: one chart with two scales can make any two lines look related.
Controls
- Flow: FII, DII or FII + DII
- Index: NIFTY or BANKNIFTY
- Rolling sums: 5-day and 20-day
- Range: 1 month to all the history held
- Report: Combined (NSE+BSE) or NSE only
Keep in mind
Two series on one date axis, not a cause and its effect.
Flows vs NIFTY questions
Does FII selling make NIFTY fall?
This chart shows the two side by side; it does not measure cause. Stretches where they move together and stretches where they part are both common.
Can I compare with BANKNIFTY?
Yes. Switch the index to BANKNIFTY and the bottom panel shows its close instead.
Related tools and guides
Daily net flow
FII and DII net buying and selling in the Indian cash market for each session, from NSE's provisional report, with 5, 20 and 60-session rolling sums.
Cumulative flows
FII and DII running totals of net cash-market flow, restarting each month, quarter, financial year, calendar year or from dates you pick.
FII futures long %
FII long contracts as a share of their index-futures positions, against bands from their own history, with NIFTY below, the long/short ratio and a yearly table.
All FII/DII charts
Every FII/DII chart with a screenshot and what it tells you.
Educational analytics only: not investment advice. You are responsible for your own trading decisions.