F&O heat maps: stocks, sectors, OI and IV at a glance
Twelve heat maps of the F&O market in one place, from the whole stock universe to one index's open interest across every strike and expiry.
- What it is
- Twelve heat maps of the F&O market: stock and sector moves, OI, buildup, IV, VWAP, rollover, option grids and the last week.
- Data it uses
- Every F&O stock's future and options (price, OI, IV, VWAP, turnover, rollover); option chains across every expiry for the grids; stored sessions for the week.
- Covers
- NSE F&O stocks and sectors; grids for NIFTY, BANKNIFTY, FINNIFTY, MIDCPNIFTY and NIFTY NEXT 50 and every F&O stock
- Updates
- Through the session as NSE's data arrives (15 minutes delayed); past sessions can be opened (the IV and rollover maps are today only)
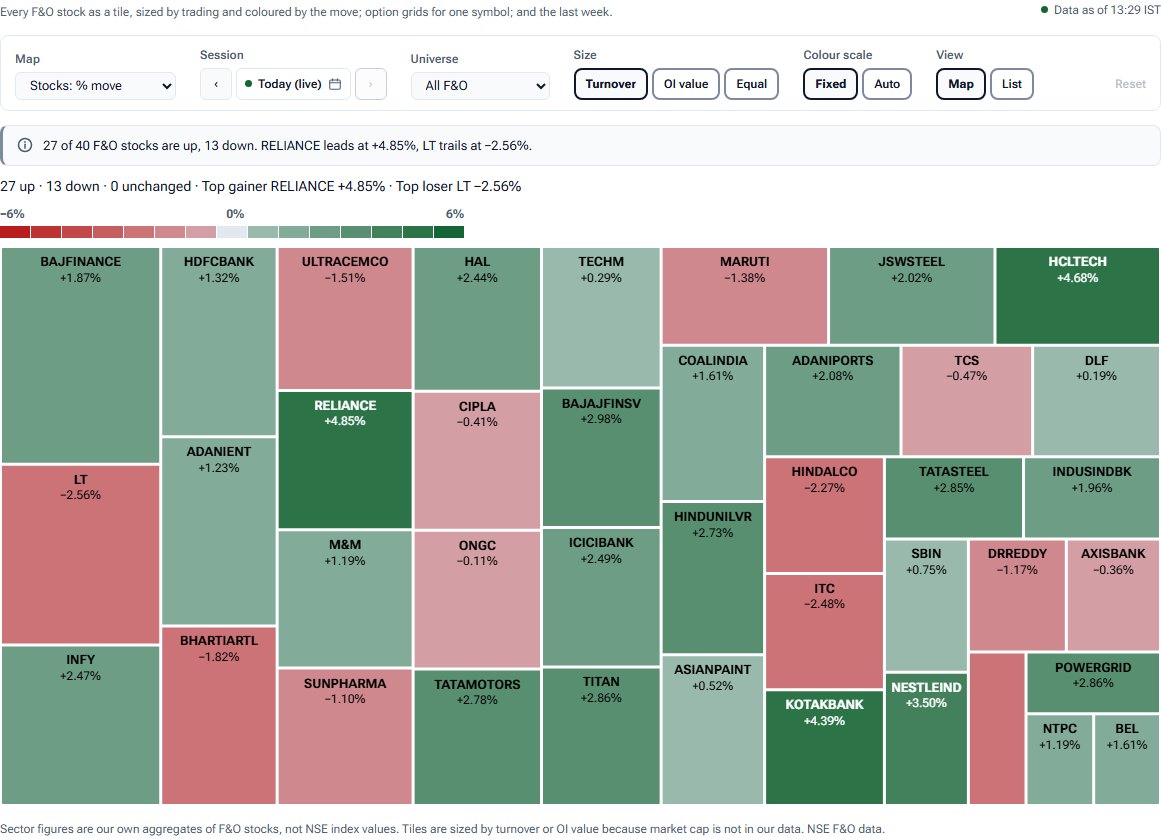
What the chart shows
- Market maps: one tile per F&O stock coloured by % move, OI change %, buildup, implied volatility, distance from VWAP or rollover. Sector maps group the same stocks by industry.
- Option grids: open interest or IV for one symbol as a strike by expiry grid, and change in OI as a strike by time grid.
- History: stocks and sectors over the last five stored sessions, plus the week compounded.
How it is worked out
Moves are against NSE's previous settlement price. A sector's figure is our own turnover-weighted mean of its F&O members, not an NSE index. Tiles are sized by turnover, by OI value, or equally.
How to read it
Use the market maps to see where money and moves are concentrated, then open a tile's chain or watchlist. Down a column of the IV grid is skew; across a row is term structure.
Controls
- Map: one of twelve
- Session: today, or a stored past session (IV and rollover are today only)
- Universe: all F&O, NIFTY 50, NIFTY NEXT 50, BANK NIFTY, FIN NIFTY or MIDCAP SELECT
- Size: turnover, OI value or equal
- Colour scale: fixed or auto
- Symbol, for the option grids
Keep in mind
Sector figures are our own aggregates of F&O stocks, not NSE index values. Tiles are not sized by market cap, which is not in our data.
Heat maps questions
Which heat maps are available?
Stocks by % move, sectors, OI change %, buildup, implied volatility, VWAP and day range, rollover, OI by strike and expiry, IV by strike and expiry, change in OI by strike and time, and stocks and sectors over the last week.
Are the sector numbers NSE's sector indices?
No. They are our turnover-weighted averages of the F&O stocks in each industry.
Can I filter to NIFTY 50 stocks?
Yes. The universe picker narrows the market maps to NIFTY 50, NIFTY NEXT 50, BANK NIFTY, FIN NIFTY or MIDCAP SELECT.
Related tools and guides
Market Breadth
The share of NSE F&O stocks advancing and declining in each session, the advance-decline ratio, and the broadest rises and falls.
Buildup Radar
Every F&O stock's future plotted by price change against OI change: long buildup, short buildup, short covering and long unwinding at a glance.
OI × time
A strike-by-time heat map of open interest added since 09:15, for calls, puts or puts minus calls, plus the call and put walls minute by minute.
All Pulse charts
Every chart in Pulse with a screenshot and what it tells you.
Educational analytics only: not investment advice. You are responsible for your own trading decisions.