ATM IV history and IV Rank for NIFTY options
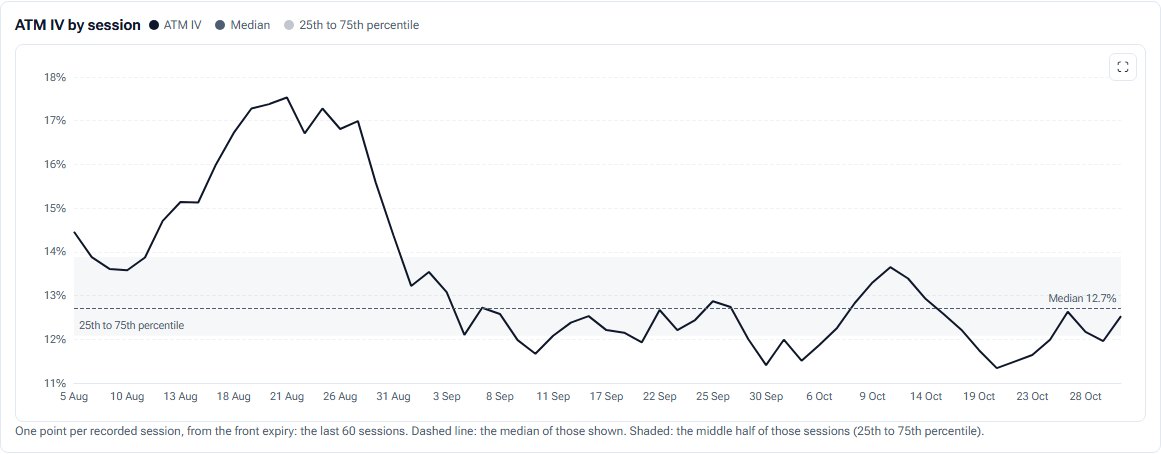
Is volatility high or low right now? This chart compares today's at-the-money IV with the index's own recorded history and gives IV Rank and IV Percentile.
- What it is
- A line chart of at-the-money implied volatility by session and through today, with IV Rank and IV Percentile.
- Data it uses
- Recorded closing ATM IV of the front expiry for each session; five-minute ATM IV samples for today; the option chain for IV now.
- Covers
- NIFTY, BANKNIFTY, FINNIFTY, MIDCPNIFTY and NIFTY NEXT 50
- Updates
- History adds one point after each close (recorded since 31 Jul 2026); IV Rank needs 20 recorded sessions
What the chart shows
- ATM IV by session: one point per recorded session, a dashed median, and a shaded 25th to 75th percentile band.
- ATM IV through the session: five-minute samples of the front expiry's ATM IV today.
- Cards: ATM IV now, the last daily close, IV Rank, IV Percentile, and the range from low to high with its median.
How it is worked out
IV Rank = (current minus low) ÷ (high minus low) over up to the last 252 recorded sessions. IV Percentile = the share of recorded sessions with a lower IV. Both appear once 20 sessions are recorded and do not change with the range you view.
How to read it
A high rank or percentile means options are expensive against their own past, which favours selling premium; low means cheap. When rank and percentile disagree, one extreme day has usually stretched the range.
Controls
- Session: today, or a stored past session
- Expiry: one, for ATM IV now
- Range: 1, 3 or 6 months
Keep in mind
Recording started on 31 Jul 2026, so the history is still building. IV Rank is usually quoted on a full year of sessions; a shorter record makes a smaller claim. India VIX is not in NSE's F&O feed, so it is not overlaid.
For the idea behind the chart, read Implied volatility explained.
ATM IV history questions
What is IV Rank?
Where today's implied volatility sits between the lowest and highest values in the record, from 0 (the low) to 100 (the high).
What is the difference between IV Rank and IV Percentile?
Rank uses only the high and low; percentile counts how many sessions were lower. One spike moves rank a lot and percentile very little.
How far back does the history go?
To 31 Jul 2026, when recording started. The page says how many sessions it holds.
Related tools and guides
IV Skew
Implied volatility at every strike for calls and puts, the 5% put-call skew, and ATM IV across the next six expiries.
Expected move
The index range options are priced for, from the ATM straddle and from implied volatility, for the next six expiries, scored against how far the index actually moved.
Straddle Premium
The at-the-money call plus put premium through the session with its VWAP, the auto-ATM line, time value and decay per hour, from NSE minute bars.
All Pulse charts
Every chart in Pulse with a screenshot and what it tells you.
Educational analytics only: not investment advice. You are responsible for your own trading decisions.