FII / DII Flows

What foreign and domestic institutions did, day by day

FII and DII net buying in cash, how FIIs are positioned in index futures and options, which sectors foreign investors bought, and the rupee beside it. Each card names its source and date.

New here? Start free, no card needed.

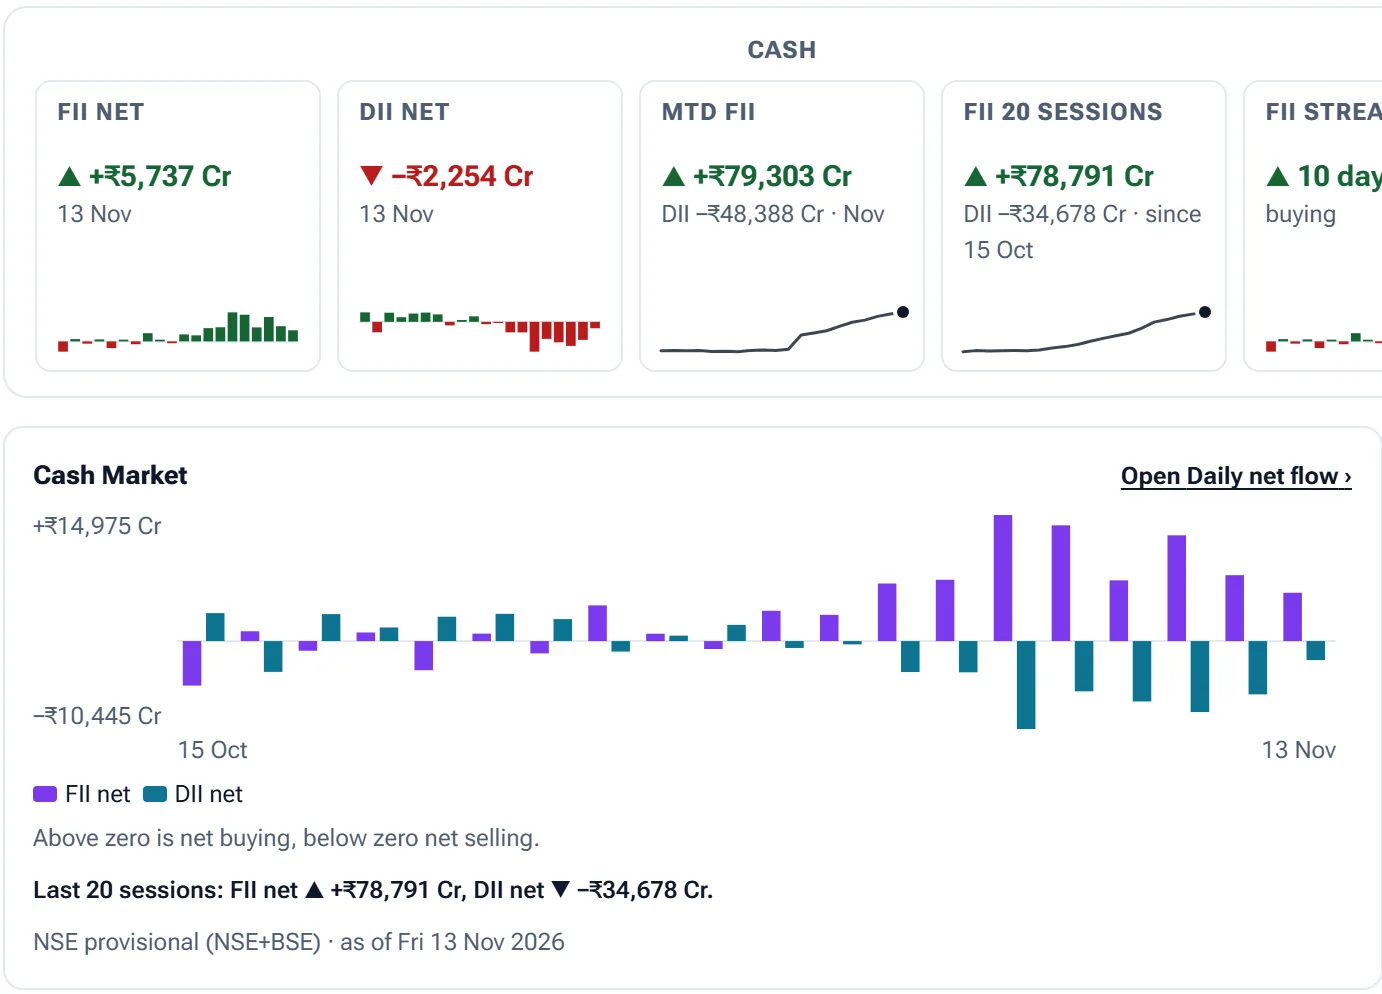
Sourced and datedCash tiles for FII net, DII net, month to date, 20 sessions and the FII streak, above the daily FII and DII net flow chart

Four views of institutional money

Overview puts one card from each view on a page. Each tab then opens its own charts and tables.

Cash market

Daily FII and DII net buying or selling from NSE's provisional report, with month to date, the last 20 sessions and the current buying or selling streak.

  • FII vs DII, flows vs NIFTY, cumulative
  • Monthly heat map, streaks and records
  • Switch between the combined report and NSE only
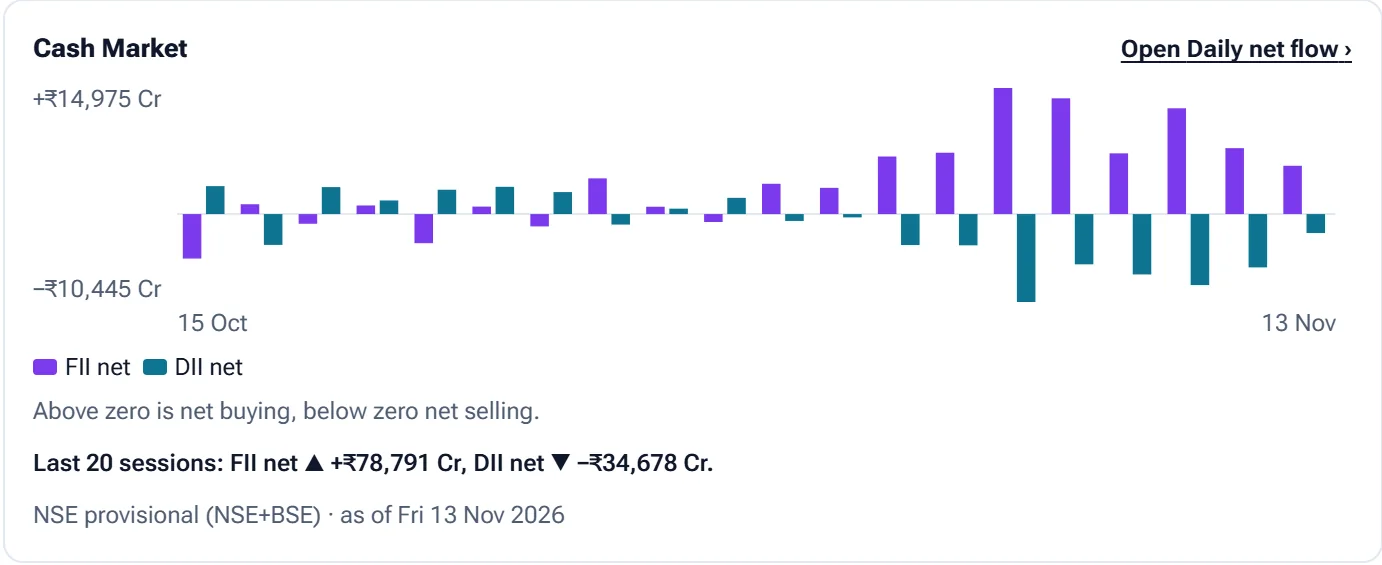
Cash Market chart of FII and DII net flows over 20 sessions, with the 20-session totals written below

Derivatives positioning

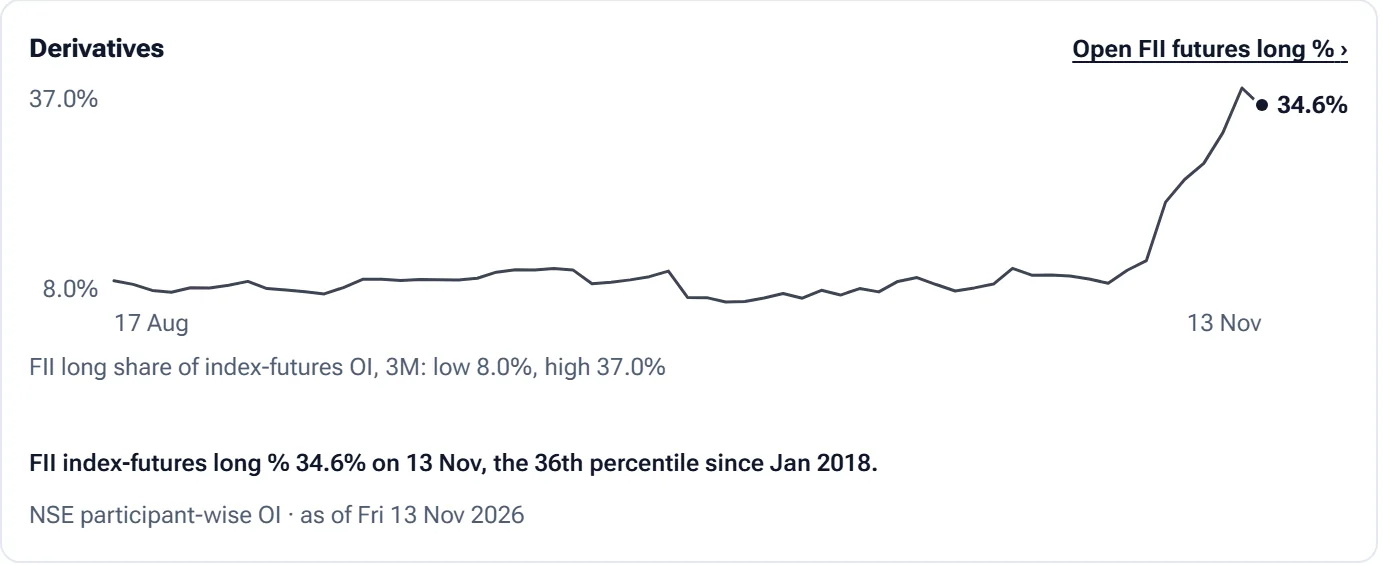
From NSE's participant-wise open interest: the FII share of long index futures and its percentile since January 2018, net index futures for FIIs, Pros and Clients, and FII index calls and puts.

  • Positions matrix by participant
  • Client vs FII, futures change, options
  • A positioning index from 0 to 100
Derivatives chart of the FII long share of index futures over three months, ending at 34.6%

FPI sectors

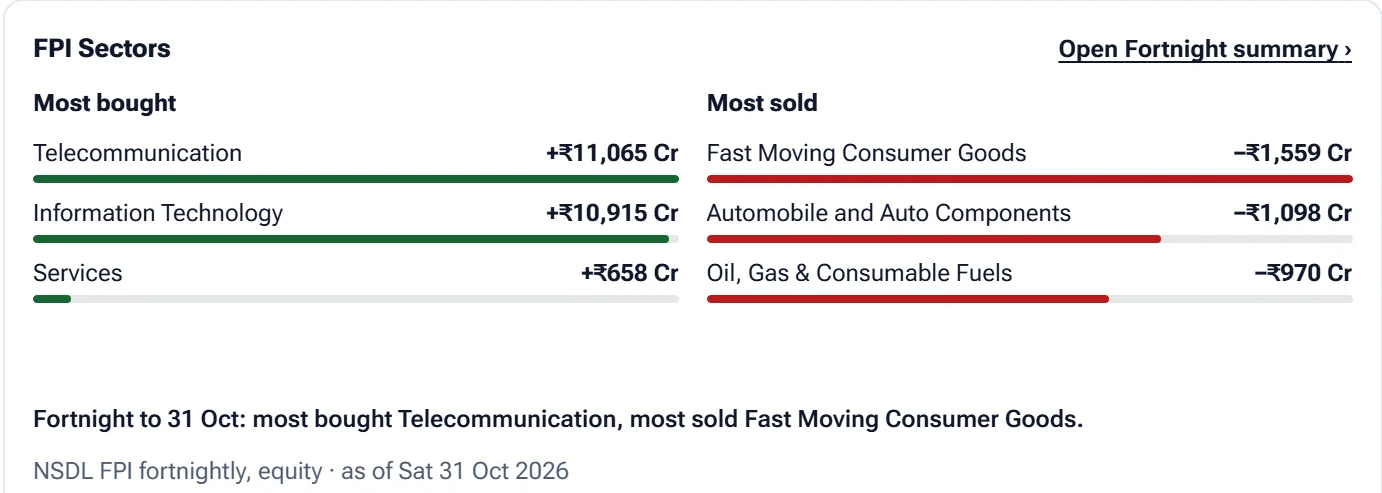
NSDL's fortnightly figures show which sectors foreign portfolio investors bought and sold most, with sector history and how the latest fortnight compares with each sector's own past.

  • Fortnight summary and sector flows
  • Sector by fortnight heat map
  • Assets under custody weight and change
FPI Sectors card listing the most bought and most sold sectors for the fortnight

Macro: flows and the rupee

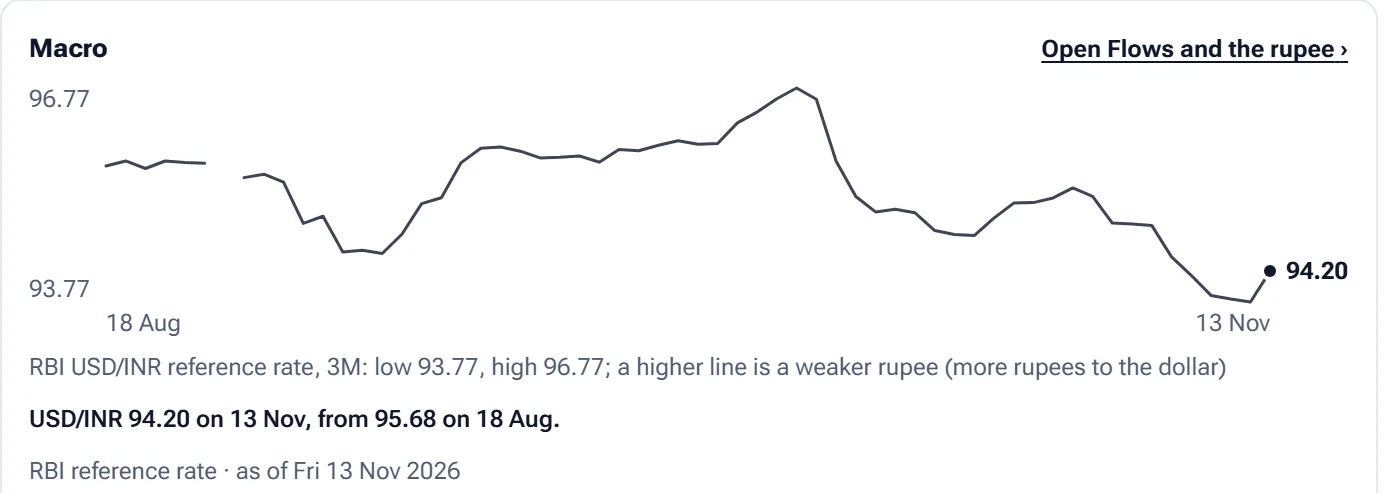
FII flows set against the RBI USD/INR reference rate, with a rolling correlation, a flow vs rupee scatter, flow vs NIFTY and past selling episodes.

  • A higher line means a weaker rupee
  • Monthly table with month-end rate
  • Selling episodes ranked
Macro card charting the USD/INR reference rate over three months

On every card

Source and date

Each card names its report and the date it covers, so you know how old the figure is.

A sentence that reads it

Charts end with one line saying what the latest figure is, in plain words.

Download CSV

Cards with a table hand over the rows as a CSV file.

Ask EzyAI

Ask what the flows show. It explains; it does not give buy or sell calls.

Open FII / DII data on today's data

NSE data, 15 minutes delayed. Analytics, not advice.

Open FII / DII data

Start free

Educational analytics only: not investment advice. You are responsible for your own trading decisions.