Market Dashboard

The F&O market on one screen when you sign in

Home opens on a Market Snapshot of each index with its option numbers, then a board of cards you choose: mood, breadth, expected move, buildup, ban list, FII/DII and more. NSE data, 15 minutes delayed.

New here? Start free, no card needed.

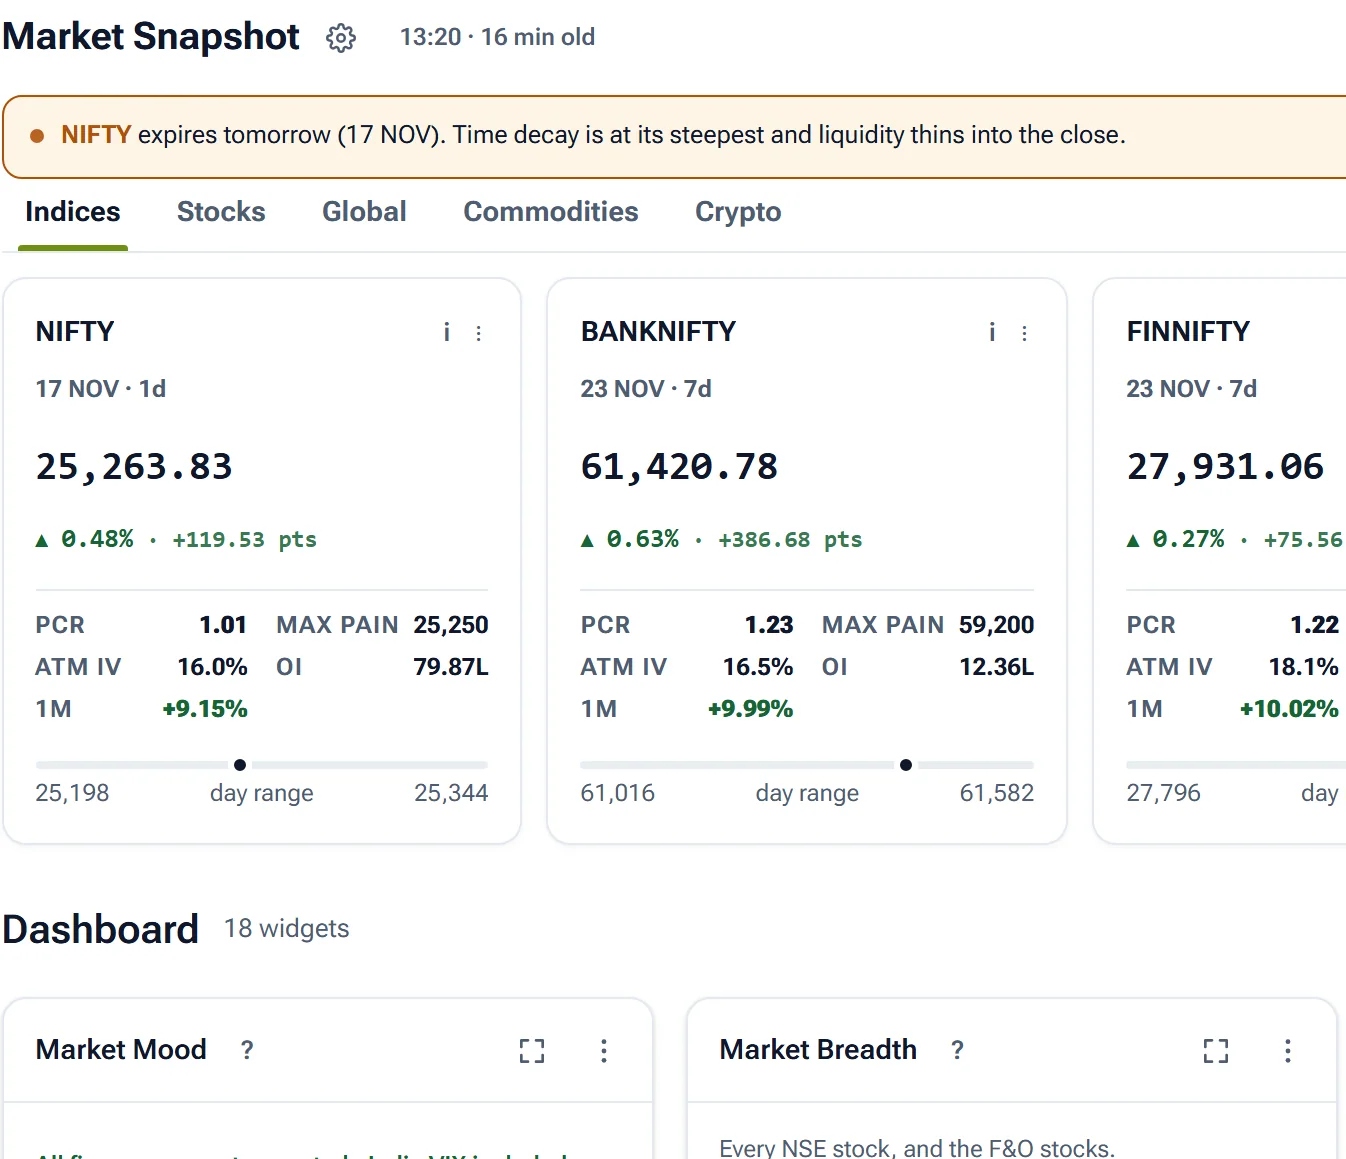
NSE data, 15 min delayedMarket Snapshot header with an expiry notice and the NIFTY and BANKNIFTY cards, above the first Dashboard cards

What Home shows you

Every card says where its figures come from and how old they are. Open any card full size for the detail behind it.

Each index with its option numbers

One card per index: price and day change, then PCR, max pain, ATM IV, open interest, the one-month move and where price sits in the day's range. Tabs switch to stocks, global markets, commodities and crypto.

  • Expiry date and days left on every card
  • A notice when an index expires tomorrow
  • Gear icon picks the tabs, cards, order and currency
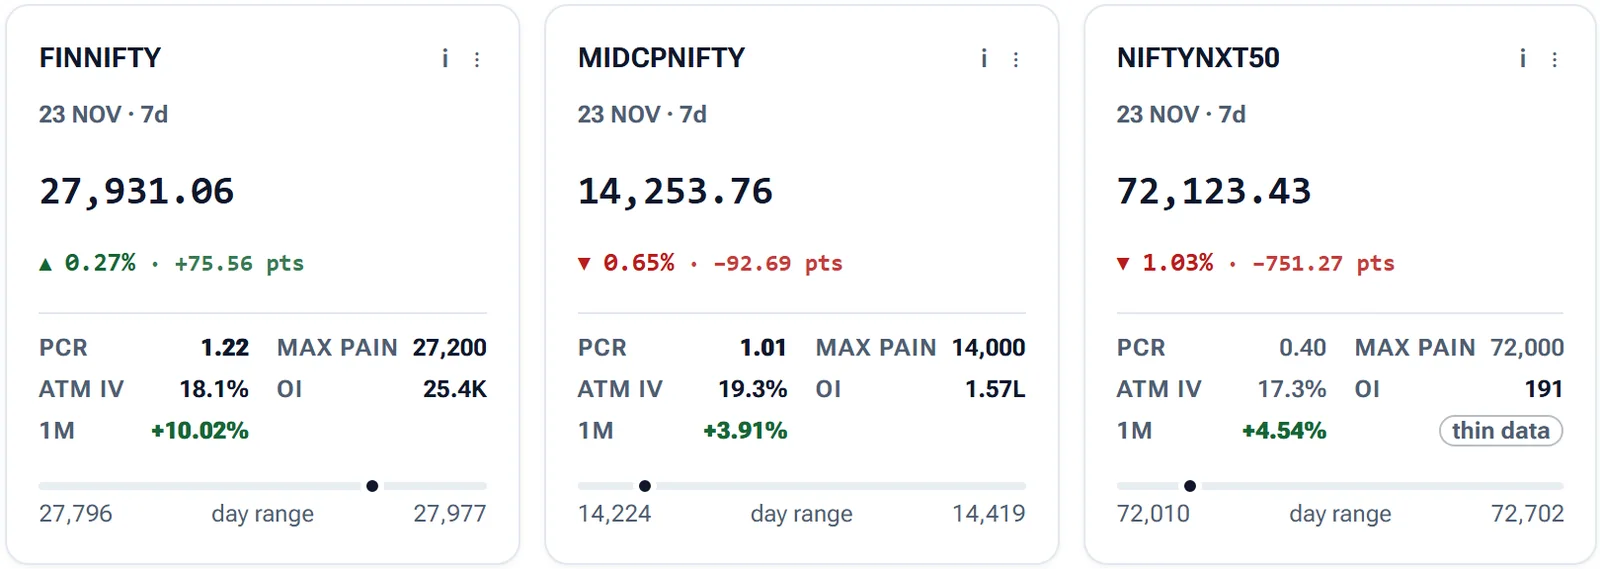
Snapshot cards for FINNIFTY, MIDCPNIFTY and NIFTYNXT50 showing PCR, max pain, ATM IV, OI and day range

The day's tone at a glance

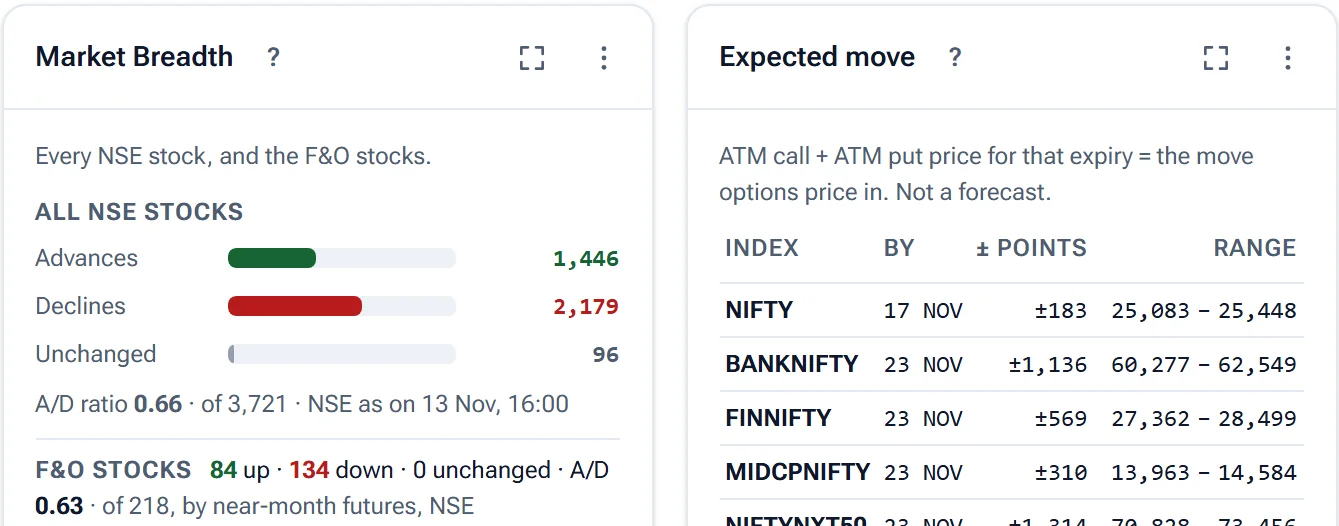
Market Breadth counts advances and declines for every NSE stock and for the F&O stocks. Expected move turns the ATM straddle into a points range per index, and says it is not a forecast.

  • Market Mood: PCR, IV skew, India VIX, FII flow, price
  • Every component shown, not just a score
  • Expected move up to each index's next expiry
Market Breadth card with advances and declines, next to the Expected move table of points and ranges per index

Where positions are building

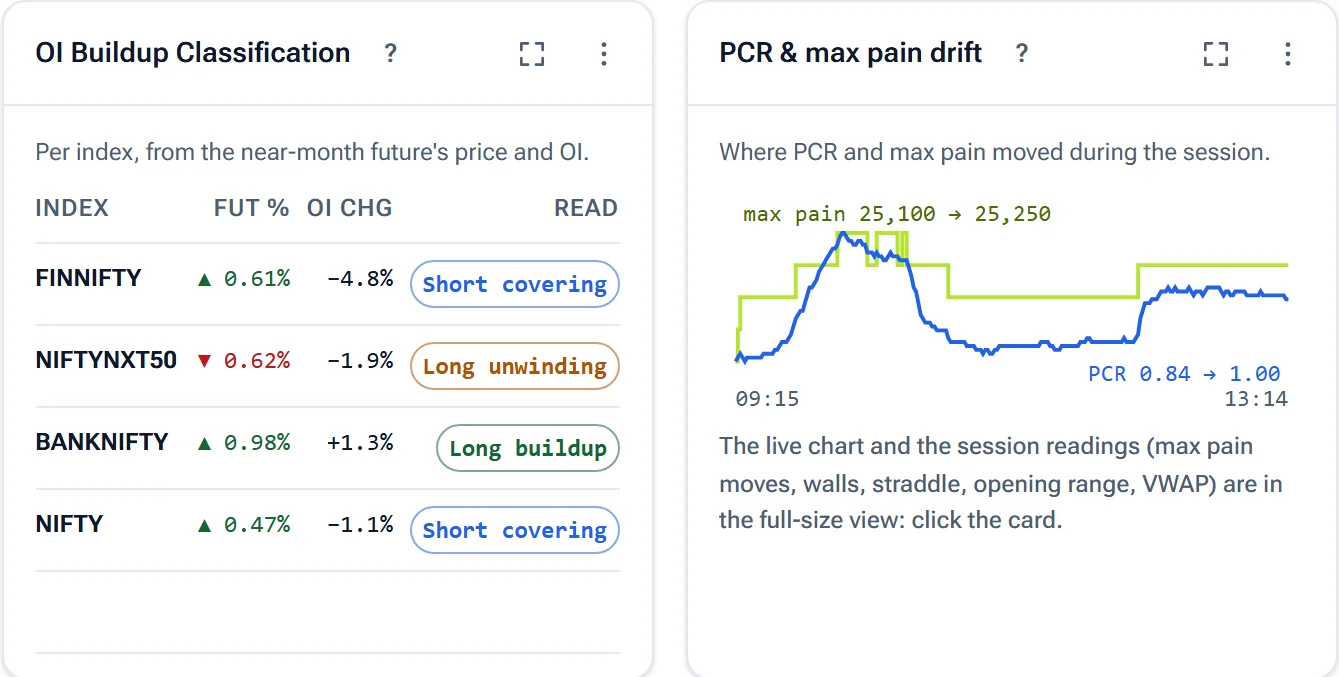
OI Buildup Classification labels each index long buildup, short covering, long unwinding or short buildup from its near-month future. PCR & max pain drift charts how both moved through the session.

  • Largest OI change first
  • Max pain drawn as steps, because it sits on strikes
  • IV movers: stocks whose ATM IV moved most
OI Buildup Classification table with short covering and long buildup tags, beside the PCR and max pain drift chart

The calendar and the rules

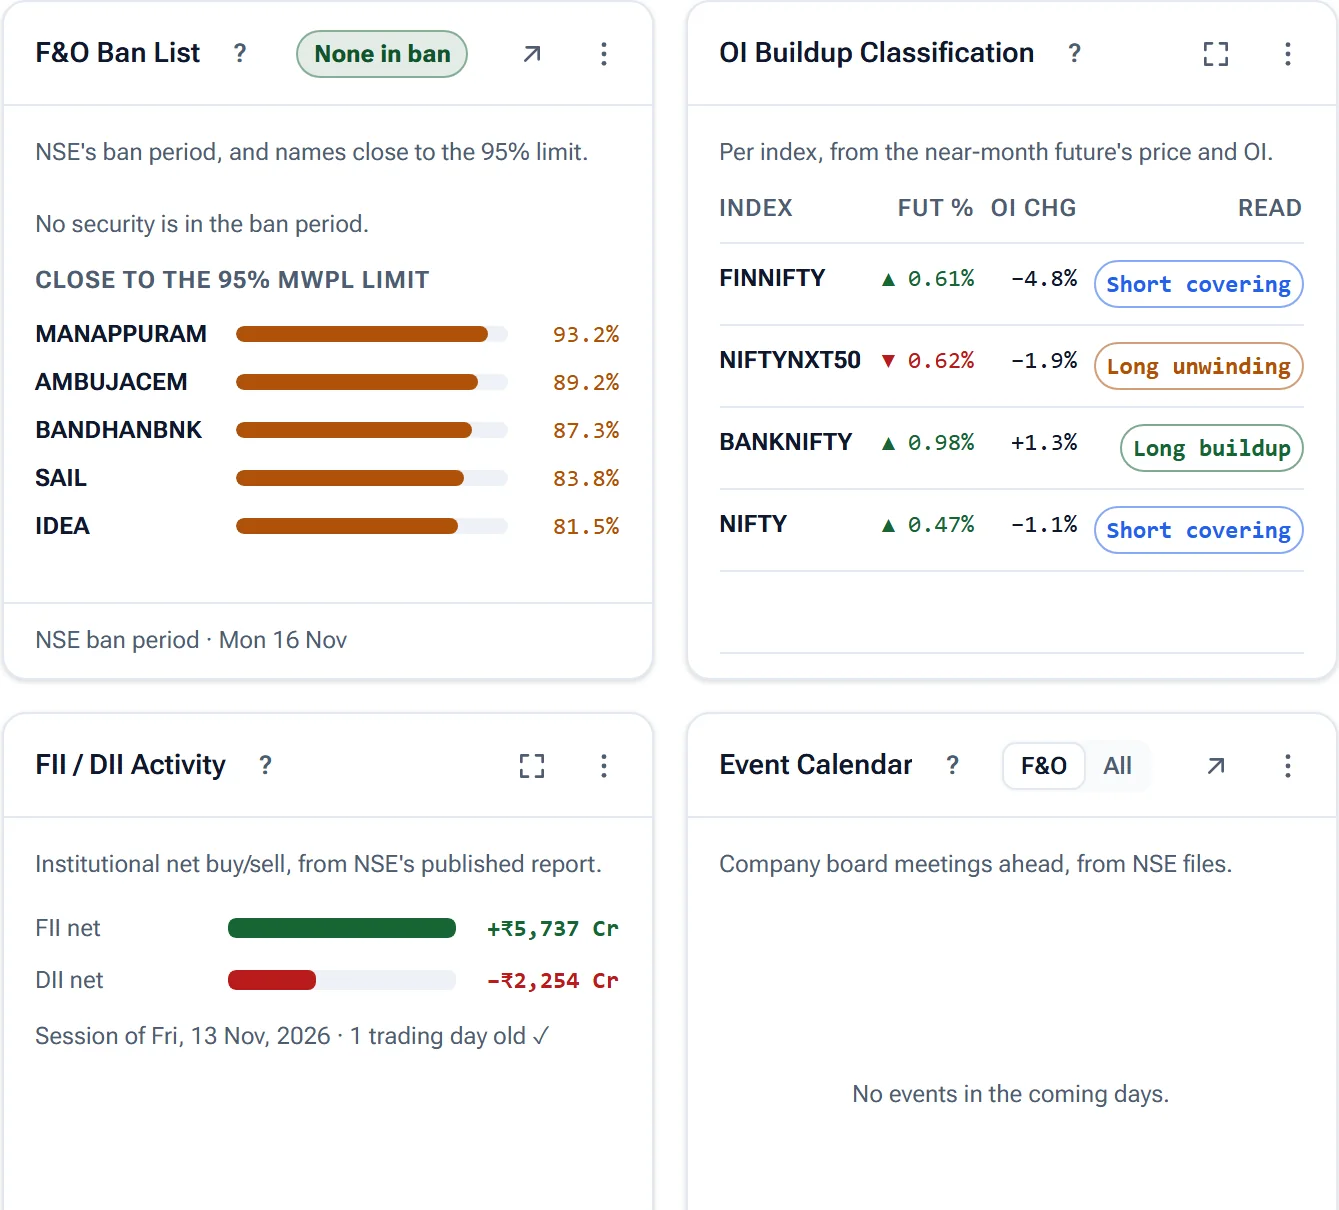
The F&O ban list shows names in NSE's ban period and those close to the 95% limit. FII / DII Activity gives the latest net figures from NSE's report, and the event, results and holiday cards show what is coming.

  • Ban list from the imported NSE file
  • Holiday cards say when an expiry moves
  • Arrows open the full list on its own page
F&O Ban List card with stocks near the position limit, above the FII / DII Activity and Event Calendar cards

Make the board yours

Customise

Show, hide and reorder every card from one list. Cancel leaves the board as it was.

Saved layouts

Keep more than one arrangement of the board and switch between them.

Full size on any card

Open a card full size for its history, filters and the reasoning behind a reading.

Honest timestamps

The snapshot says how old its figures are, and each card names its source and date.

Open Home on today's data

NSE data, 15 minutes delayed. Analytics, not advice.

Open Home

Start free

Educational analytics only: not investment advice. You are responsible for your own trading decisions.