Unusual options activity across every NSE F&O contract
Which options are trading far more than they normally would? This scanner compares every NSE F&O option with its neighbouring strikes and flags the ones that stand out.
- What it is
- A ranked bar chart of options trading far heavier than their neighbouring strikes, plus one-minute volume bursts.
- Data it uses
- Every NSE F&O option's volume, open interest (opening and current), price and turnover today, and its minute-by-minute volume.
- Covers
- Every index and stock option in NSE's F&O segment
- Updates
- Every minute during the session; today only, not stored for past sessions
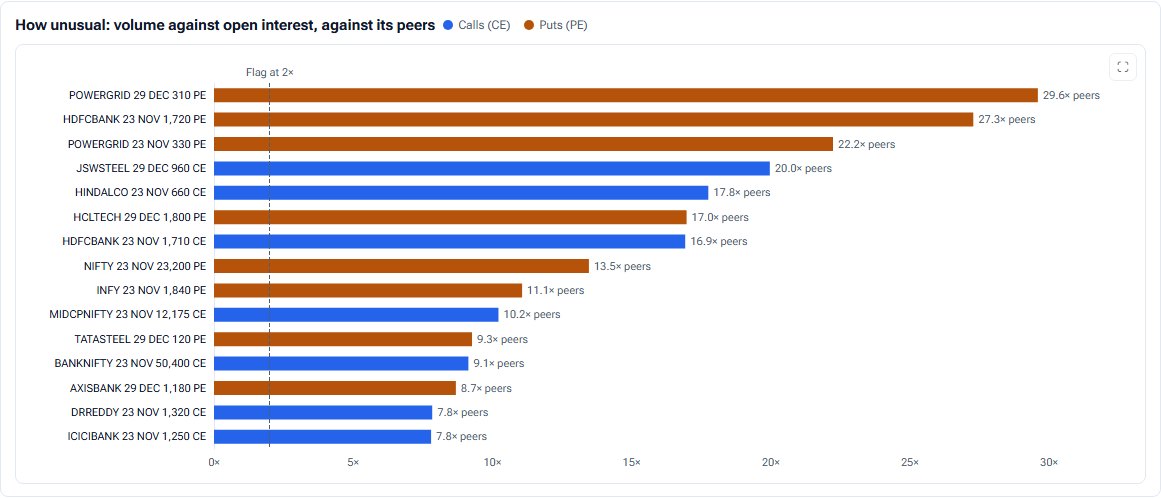
What the chart shows
- Horizontal bars for the 15 most unusual contracts, length showing how many times heavier than its peers each one is trading. Calls blue, puts orange, with a dashed line at the flag level.
- A table with price, change, volume against OI, volume, OI, change in OI and turnover. Under More detail: one-minute bursts.
- Cards: the most unusual contract, how many are flagged, how many bursts, and the largest turnover.
How it is worked out
Volume against OI is today's volume divided by the larger of opening and current OI. A contract is compared with the median of up to five traded strikes either side, same symbol, expiry and side. It is flagged at 2× its peers or more, with volume at least equal to OI and at least ₹25 lakh of premium traded. A burst is a minute with at least 5× the contract's average minute and ₹10 lakh of premium.
How to read it
A strike trading far heavier than its neighbours is where someone is opening or closing size. Check the price and OI change beside it before reading any direction into it.
Controls
- Contracts: all, index or stocks
- Type: all, calls or puts
- Flag at: 2×, 3× or 5×
Keep in mind
Activity, not direction: neither list says which side traded. Options only. These lists are built from today's data and are not stored for past sessions.
Unusual activity questions
What counts as unusual options activity?
A contract trading at least twice as heavily as its neighbouring strikes, relative to its open interest, with real money behind it (₹25 lakh or more of premium).
Does unusual activity mean someone is bullish?
Not by itself. A big trade can be a buy or a sell, an opening or a closing. Read it with price and OI change.
Does it include stock options?
Yes. Every index and stock option in NSE's F&O segment is scanned.
Related tools and guides
Change in OI
Today's change in call and put open interest at every strike: who is writing, who is covering, and what changed in the last 15, 30 or 60 minutes.
Buildup Radar
Every F&O stock's future plotted by price change against OI change: long buildup, short buildup, short covering and long unwinding at a glance.
Heat maps
Twelve heat maps of NSE F&O: stock and sector moves, OI change, buildup, IV, VWAP, rollover, strike by expiry grids and the last week.
All Pulse charts
Every chart in Pulse with a screenshot and what it tells you.
Educational analytics only: not investment advice. You are responsible for your own trading decisions.