Monthly flows: FII and DII net flow by month and year
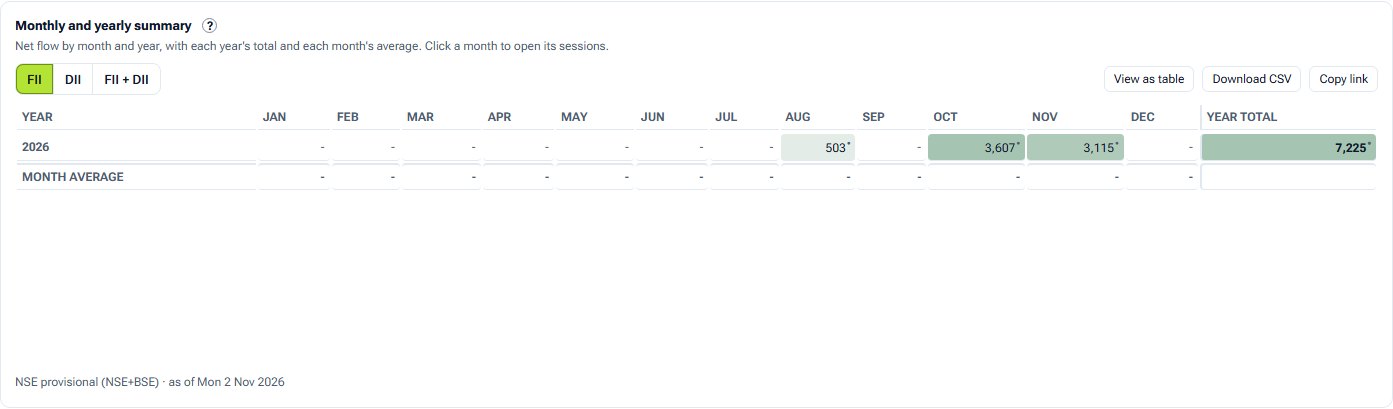
Every month's net flow in one grid: years down the side, months across, greener for net buying and redder for net selling.
- What it is
- A heat map of net flow by month and year, with each year's total and each month's average.
- Data it uses
- NSE's provisional FII/DII cash-market report: buy, sell and net in ₹ crore for each session.
- Covers
- Combined NSE, BSE and MSEI trades (the default), or NSE alone
- Updates
- Each trading day, from NSE's evening report (read between 18:30 and 21:30 IST); NSE may revise a provisional figure
What the chart shows
- Rows are years, columns months, and each cell is that month's net in ₹ crore.
- Year total adds the months; Month average is over the years that month is fully held.
- Click a month to open its sessions as a bar chart, FII solid and DII outlined. A dot marks a month only partly held.
How it is worked out
A cell adds the month's session nets. Months the history only partly holds (it starts inside them, a session was missed, or the month is still running) are marked and kept out of the average.
How to read it
Read runs of colour across the months; one dark cell can come from a single large day.
Controls
- Series: FII, DII or FII + DII
- Click a month: its sessions
- Report: Combined (NSE+BSE) or NSE only
- View as table
Keep in mind
The latest month is usually still running, and the first is cut where the history starts.
Monthly flows questions
What does a dot on a cell mean?
The month is only partly held: the history starts inside it, a session is missing, or it is still running. Those months stay out of the Month average.
Can I see the days inside a month?
Yes. Click the cell and that month's sessions open below the grid.
Related tools and guides
Cumulative flows
FII and DII running totals of net cash-market flow, restarting each month, quarter, financial year, calendar year or from dates you pick.
Daily net flow
FII and DII net buying and selling in the Indian cash market for each session, from NSE's provisional report, with 5, 20 and 60-session rolling sums.
Sector flows
FPI equity net investment by sector from NSDL's fortnightly report: bought to the right, sold to the left, as bars, a flow map or holdings, for the latest fortnight or a longer window.
All FII/DII charts
Every FII/DII chart with a screenshot and what it tells you.
Educational analytics only: not investment advice. You are responsible for your own trading decisions.