Futures buildup: index futures price, VWAP and OI through the day
Price tells you what moved; open interest tells you whether new money came in. This chart reads both for the index future, bucket by bucket through the session.
- What it is
- A price-and-VWAP line with bars of open interest added per time bucket, coloured by long buildup, short buildup, short covering or long unwinding.
- Data it uses
- NSE minute bars for the index's near, next and far month futures: price, volume and open interest.
- Covers
- The futures of NIFTY, BANKNIFTY, FINNIFTY, MIDCPNIFTY and NIFTY NEXT 50
- Updates
- Every minute during the session; 3 or 5 sessions can be joined, and stored past sessions opened
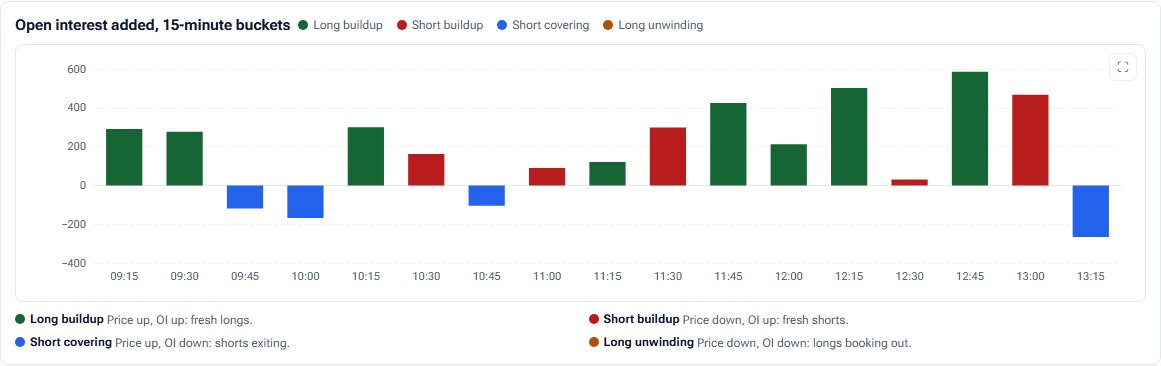
What the chart shows
- Price and VWAP: the future's price each minute against its running VWAP.
- Open interest added: one bar per bucket, coloured by its buildup. Green is long buildup, red short buildup, blue short covering, amber long unwinding.
- Cards: the session's buildup so far, last price against VWAP, VWAP crossings, the biggest OI bucket, and counts of each kind of bucket.
How it is worked out
In each bucket, price change and OI change are measured from the previous bucket's close. Price up with OI up is long buildup; down with OI up, short buildup; up with OI down, short covering; down with OI down, long unwinding. VWAP is volume-weighted on the typical price (high + low + close) ÷ 3.
How to read it
Price holding above VWAP with long-buildup bars says fresh longs are in charge. A rally made of short covering (blue) is weaker than one made of long buildup.
Controls
- Session: today, or a stored past session
- Days: intraday, or 3 or 5 sessions
- Interval: 1, 5, 15 or 30 minutes
- Contracts: near, next and far month
- Open interest: as OI or as change
Keep in mind
One bucket is a moment, not a trend, and the last half hour is usually busy with positions closing. Buildup describes positioning, not direction.
Futures buildup questions
What is long buildup?
Price and open interest both rising: new long positions are being opened.
What is the difference between short covering and long buildup?
Both lift price, but short covering does it while open interest falls, as shorts close. Long buildup adds new positions.
Which futures does it cover?
The selected index's near, next and far month futures.
Related tools and guides
Buildup Radar
Every F&O stock's future plotted by price change against OI change: long buildup, short buildup, short covering and long unwinding at a glance.
Change in OI
Today's change in call and put open interest at every strike: who is writing, who is covering, and what changed in the last 15, 30 or 60 minutes.
Delta exposure
Estimated dealer delta at every strike, today's change, and the futures hedge it implies, in ₹ crore or lots, on the same dealer model as GEX.
All Pulse charts
Every chart in Pulse with a screenshot and what it tells you.
Educational analytics only: not investment advice. You are responsible for your own trading decisions.