IV Skew: the volatility smile and term structure for NIFTY
Options at different strikes are priced at different volatilities. The smile shows how much more traders pay for downside protection, and the term structure shows how volatility is priced across expiries.
- What it is
- A line chart of implied volatility across strikes for calls and puts (the smile), with ATM IV for the next six expiries.
- Data it uses
- NSE option chain: implied volatility of each call and put; chains for the next six expiries for the term structure; spot.
- Covers
- NIFTY, BANKNIFTY, FINNIFTY, MIDCPNIFTY and NIFTY NEXT 50
- Updates
- Through the session as NSE's data arrives (15 minutes delayed); past sessions can be opened
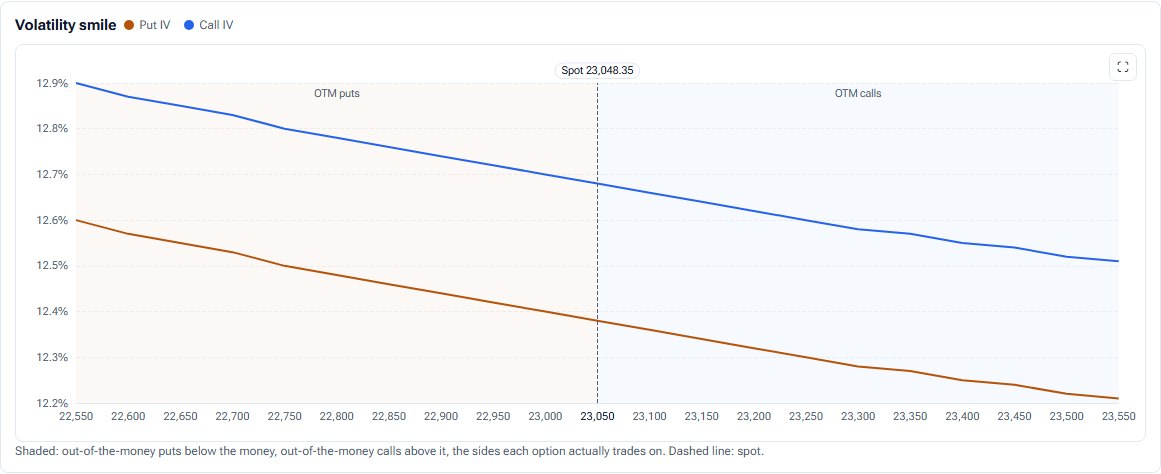
What the chart shows
- Volatility smile: put IV in orange and call IV in blue across strikes, with out-of-the-money puts and calls shaded, the at-the-money band and a dashed spot line.
- Term structure: at-the-money IV for each of the next six expiries, as labelled bars.
- Cards: ATM IV, the IV of the put about 5% below spot and the call about 5% above, the skew between them, and far minus near.
How it is worked out
Skew is the IV of the put about 5% below spot minus the IV of the call about 5% above spot, using the nearest strikes. ATM IV averages the call and put IV at the strike nearest spot. Far minus near is the farthest of the six expiries' ATM IV less the nearest.
How to read it
Index puts usually cost more than calls because traders pay for downside protection. A skew that steepens means that protection is getting dearer; an upward term structure means later expiries are priced for more movement.
Controls
- Session: today, or a stored past session
- Expiry: one, for the smile
- Strikes: around the money, or a custom range
- Side: both, puts or calls
Keep in mind
Implied volatility is what option prices assume, not a forecast. In-the-money IV mostly reflects the bid-ask spread. The term structure always reads today's chains.
For the idea behind the chart, read Implied volatility explained.
IV Skew questions
What is IV skew?
The difference in implied volatility between out-of-the-money puts and calls. Here it is the put about 5% below spot minus the call about 5% above.
Why are NIFTY puts more expensive than calls?
Demand for downside protection. Portfolio hedgers buy puts, which lifts their implied volatility.
What is the term structure?
At-the-money implied volatility for each upcoming expiry, side by side, showing how volatility is priced over time.
Related tools and guides
ATM IV history
At-the-money implied volatility session by session and through the day, with IV Rank, IV Percentile, the median and the usual range.
Straddle Premium
The at-the-money call plus put premium through the session with its VWAP, the auto-ATM line, time value and decay per hour, from NSE minute bars.
Expected move
The index range options are priced for, from the ATM straddle and from implied volatility, for the next six expiries, scored against how far the index actually moved.
All Pulse charts
Every chart in Pulse with a screenshot and what it tells you.
Educational analytics only: not investment advice. You are responsible for your own trading decisions.