Max Pain chart: total option pain at every NIFTY strike
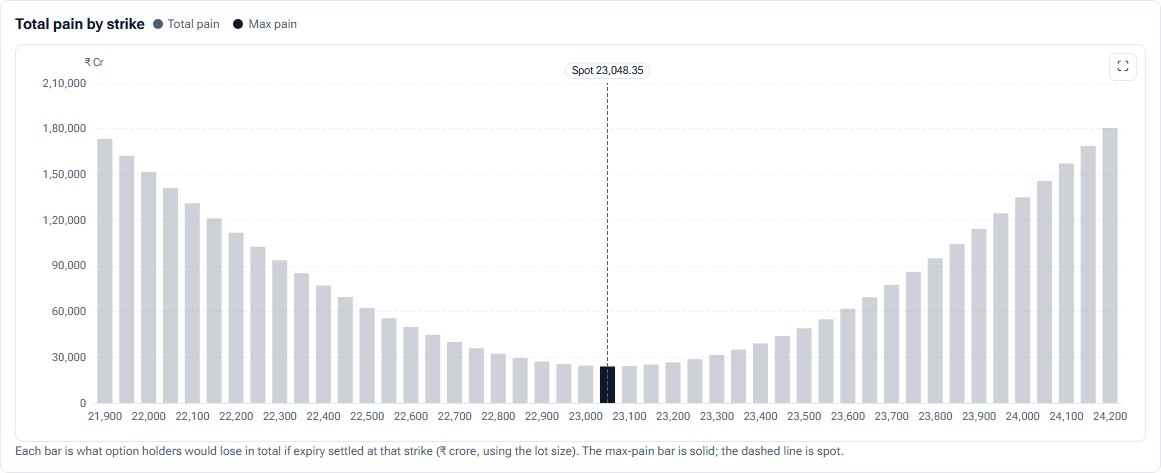
Max pain is the strike where option buyers as a group would lose the most at expiry. This chart draws the total pain at every strike so you can see the whole basin, not just its lowest point.
- What it is
- A bar chart of what every open option would be worth, in rupees, if expiry settled at each strike; the lowest bar is max pain, where buyers as a group lose the most.
- Data it uses
- NSE option chain: call and put open interest at every strike of one expiry; the lot size; spot.
- Covers
- NIFTY, BANKNIFTY, FINNIFTY, MIDCPNIFTY and NIFTY NEXT 50
- Updates
- Through the session as NSE's data arrives (15 minutes delayed); past sessions can be opened; the last five stored sessions are shown for comparison
What the chart shows
- Bars of total pain by strike in ₹ crore, within ±3%, ±5% or ±8% of spot. The max pain bar is solid; the rest of the basin is light. Spot is a dashed line.
- Cards: max pain, spot, the gap between them in points and percent, days to expiry, and the pain at max pain.
- Two tables: max pain for the next four expiries, and this expiry's max pain over the last five stored sessions, so you can see whether it is moving.
How it is worked out
For each candidate strike K, pain is the sum of call OI times (K minus strike) for strikes below K, plus put OI times (strike minus K) for strikes above K, times the lot size. Max pain is the strike with the smallest total.
How to read it
A deep, narrow basin singles out one strike; a flat one means no strike stands out. Compare max pain with spot and with where it sat in earlier sessions.
Controls
- Session: today, or a stored past session
- Expiry: one, because max pain belongs to one settlement
- Strikes: ±3%, ±5% or ±8% of spot
- Replay: any minute of today's session
Keep in mind
Some traders expect expiry to drift toward max pain. That is a tendency people argue about, not a rule, and the chart does not test it. Max pain describes open positions, not where the index will settle.
For the idea behind the chart, read Max Pain explained.
Max Pain questions
How is max pain calculated?
At each strike, add up what every open call and put would be worth at expiry if the index settled there, in rupees. Max pain is the strike where that total is smallest.
Does the index settle at max pain?
Not reliably. It is a reading of where open interest sits. Treat it as context, not a target.
Can I see max pain for next week's expiry?
Yes. The Max pain by expiry table lists the next four expiries, each with its gap to spot and its PCR.
Related tools and guides
OI by Strike
Call and put open interest at every strike, with call and put walls, max pain and spot marked. Sum several expiries, show today's change, and replay the session.
PCR history
The index's put-call ratio session by session against its own usual range, and minute by minute through today, with OI, volume and OI-added PCR.
Expected move
The index range options are priced for, from the ATM straddle and from implied volatility, for the next six expiries, scored against how far the index actually moved.
All Pulse charts
Every chart in Pulse with a screenshot and what it tells you.
Educational analytics only: not investment advice. You are responsible for your own trading decisions.