Positions matrix: FII, DII, Pro and client positions in F&O
Every session NSE publishes how many contracts each kind of participant holds. This table lays them side by side for each contract group.
- What it is
- Who held what in F&O at the close: FIIs, DIIs, Pro and clients, in each contract group, with the change over the period.
- Data it uses
- NSE's participant-wise open interest for the F&O segment, published each evening.
- Covers
- NSE F&O: FIIs, DIIs, proprietary traders and clients
- Updates
- Each trading day, from NSE's evening file
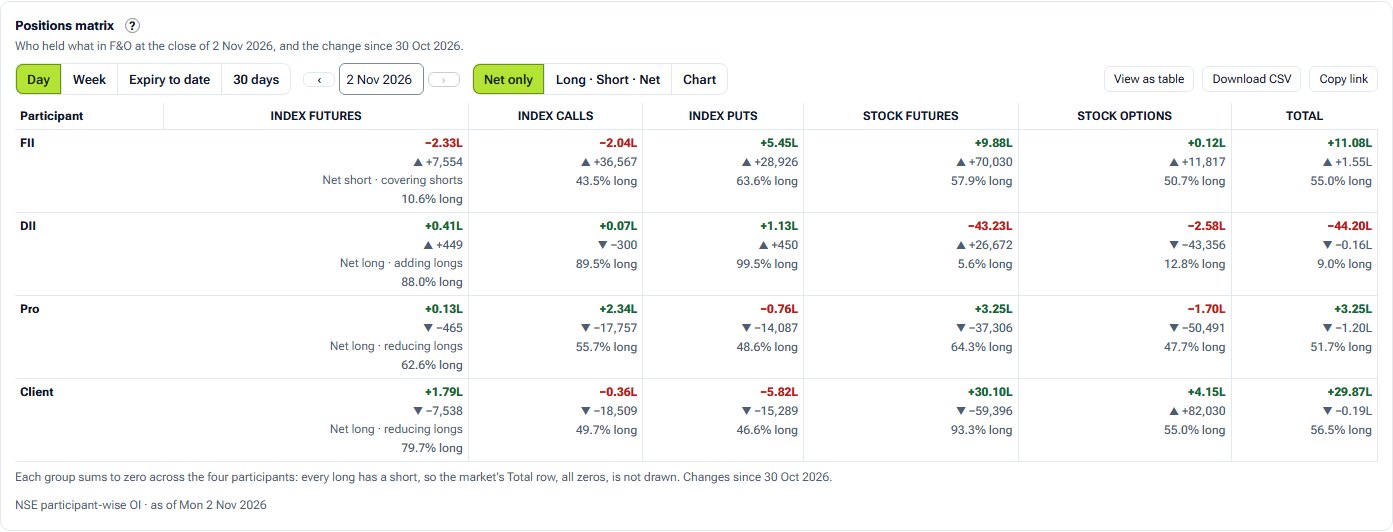
What the chart shows
- FIIs, DIIs, proprietary traders (Pro) and clients, each against index futures, index calls, index puts, stock futures, stock options and all of them together.
- Net only by default; one click shows long, short and net, and a chart view is there too.
- Under each figure, the change since the period's first session; under net, the participant's long %. Step back and forth one session at a time or pick a date.
How it is worked out
Net is long less short, in contracts. Long % is long over long plus short. Every long has a short somewhere, so in each group the four nets add to zero. Expiry to date counts from the close of the last monthly expiry.
How to read it
Because the nets sum to zero, one group's long is another's short. Many traders look at FIIs against clients, who often sit on opposite sides.
Controls
- Change over: Day, Week, Expiry to date or 30 days
- Day: previous, next or any session held
- Show: Net only, Long · Short · Net, or Chart
- Measure (chart): Net position or Change
Keep in mind
Contracts, not rupees, and a position here can be one leg of a hedge held elsewhere.
Positions matrix questions
Why is there no total row?
Every long has a short, so across the four participants each group adds to zero. A total row would be all zeros, so it is left out (it is in the table view).
Who are Pro and Client?
Pro is brokers trading on their own account; Client is everyone trading through a broker who is not an FII or DII, including retail traders.
Related tools and guides
FII futures long %
FII long contracts as a share of their index-futures positions, against bands from their own history, with NIFTY below, the long/short ratio and a yearly table.
Daily net flow
FII and DII net buying and selling in the Indian cash market for each session, from NSE's provisional report, with 5, 20 and 60-session rolling sums.
Flows and the rupee
FII net cash flow, as a 20-session sum or monthly totals, above RBI's USD/INR reference rate drawn so a stronger rupee sits higher.
All FII/DII charts
Every FII/DII chart with a screenshot and what it tells you.
Educational analytics only: not investment advice. You are responsible for your own trading decisions.