OI × time: a heat map of open interest added through the day
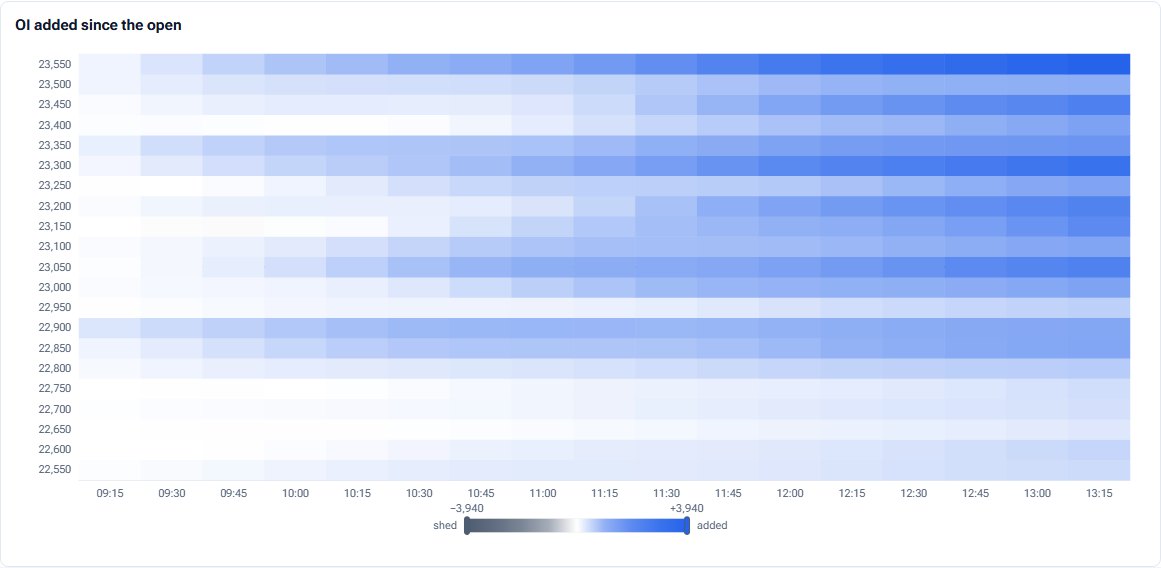
When was each wall built? This heat map lays strikes down the side and the session across the top, so you can see the hour a strike was written and whether it held.
- What it is
- A heat map of open interest added since 09:15, strikes down the side and time across the top.
- Data it uses
- NSE minute bars for each option contract (open interest per minute), up to ten strikes either side of the money; the lot size.
- Covers
- NIFTY, BANKNIFTY, FINNIFTY, MIDCPNIFTY and NIFTY NEXT 50
- Updates
- Every minute during the session; stored past sessions can be opened
What the chart shows
- Each cell is the open interest added since 09:15 at that strike, at the end of that time bucket, in contracts. Calls deepen toward blue, puts toward orange, and OI that was shed fades to grey.
- The Puts minus calls view runs from blue (calls outweigh) through neutral to orange (puts outweigh). The at-the-money row is outlined.
- A second panel, Walls through the day, steps the strike with the most call OI and the most put OI minute by minute, with spot as a thin line.
How it is worked out
Built from NSE's minute bars for each contract. A cell's value is OI at the end of the bucket minus OI at 09:15, divided by the lot size. Up to ten strikes either side of the money are drawn.
How to read it
Read across a row to see when a strike was built. A strike that turns deep at 10:00 and stays deep was written early and held; one that fills late in the day is a fresh position.
Controls
- Session: today, or a stored past session
- Expiry: one at a time
- Strikes: ±5 or ±10 around the money
- Side: Calls, Puts, or Puts minus calls
- Bucket: 15 minutes, 30 minutes or 1 hour
Keep in mind
A far expiry that has barely traded has few bars to draw, so its map can look sparse.
OI × time questions
Does the heat map show total open interest?
No. Each cell is OI added since the open, so a strike that was already heavy yesterday starts at zero today. That is what makes the timing of new positions visible.
What does grey mean?
Open interest was shed at that strike: contracts were closed out rather than opened.
Where do the numbers come from?
NSE's minute bars for each option contract, refreshed every minute during the session.
Related tools and guides
Change in OI
Today's change in call and put open interest at every strike: who is writing, who is covering, and what changed in the last 15, 30 or 60 minutes.
OI by Strike
Call and put open interest at every strike, with call and put walls, max pain and spot marked. Sum several expiries, show today's change, and replay the session.
Heat maps
Twelve heat maps of NSE F&O: stock and sector moves, OI change, buildup, IV, VWAP, rollover, strike by expiry grids and the last week.
All Pulse charts
Every chart in Pulse with a screenshot and what it tells you.
Educational analytics only: not investment advice. You are responsible for your own trading decisions.