PCR history: the put-call ratio by session and through the day
A PCR of 1.3 means little on its own. This chart sets it against the index's own history, session by session, and then shows how it moved through today.
- What it is
- A line chart of the put-call ratio, one point per session against the index's usual range, and minute by minute today.
- Data it uses
- Recorded closing PCR of the front expiry for each session; NSE minute bars for today's OI PCR; the option chain for the current ratios.
- Covers
- NIFTY, BANKNIFTY, FINNIFTY, MIDCPNIFTY and NIFTY NEXT 50
- Updates
- The history adds one point after each close (recorded since 31 Jul 2026); the intraday line updates through the session
What the chart shows
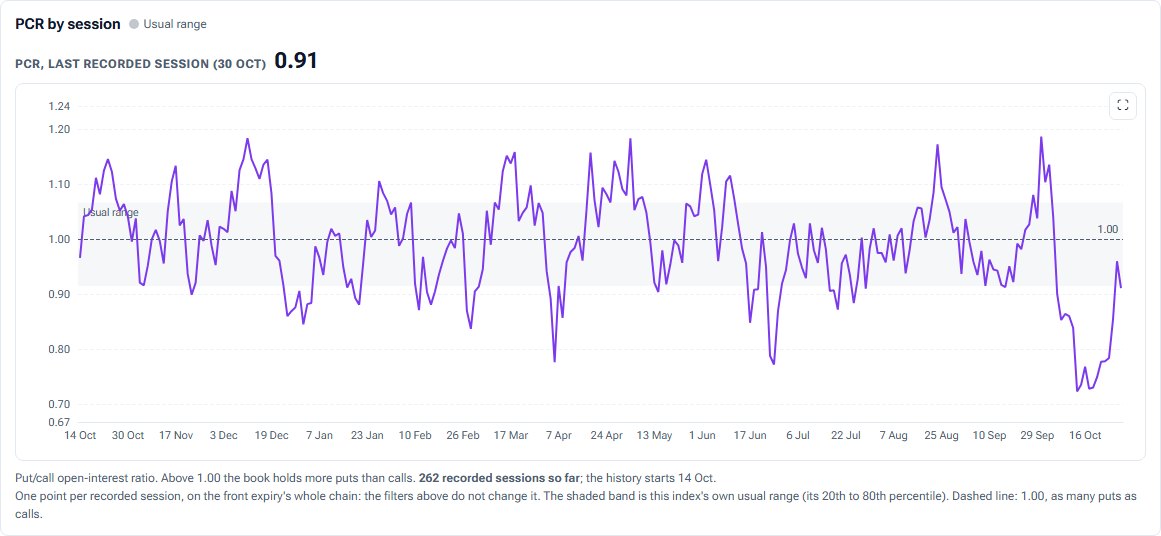
- PCR by session: one point per recorded session, with a shaded usual range (the index's own 20th to 80th percentile) and a dashed 1.00 line.
- PCR through the session: the OI put-call ratio minute by minute today.
- Cards for PCR by open interest, by volume and by OI added today, total put and call OI, and where today sits against the index's own history.
How it is worked out
PCR (OI) is put open interest divided by call open interest across the selected expiry's chain. PCR (volume) uses today's traded volume; PCR (OI added) uses only today's additions, and appears when both sides added. The session chart is the recorded front-expiry, whole-chain PCR at each close.
How to read it
Above 1 means more puts than calls are open. Judge it against this index's own usual band rather than fixed thresholds, and use the intraday slope to see whether puts are being written or bought as the day goes on.
Controls
- Session: today, or a stored past session
- Expiries: one or several (for the cards)
- Strikes: all, or a band around the money
Keep in mind
The session chart is recorded history that started on 31 Jul 2026, and it does not follow the filters. The usual range appears once 20 sessions are recorded.
For the idea behind the chart, read The put-call ratio explained.
PCR history questions
What is a high put-call ratio?
High relative to what the index usually shows. That is why this chart draws the index's own 20th to 80th percentile band instead of a fixed number.
Why can the header PCR differ from the chart?
The header is the selected expiry's chain; the session chart is the recorded front-expiry series. On a far expiry the two can differ.
Is volume PCR shown through the day?
No. NSE's feed has no per-minute volume split for this, so only the OI line is drawn intraday.
Related tools and guides
Max Pain
Total rupee pain to option buyers at every strike, the max pain strike against spot, max pain for the next four expiries and session by session.
OI by Strike
Call and put open interest at every strike, with call and put walls, max pain and spot marked. Sum several expiries, show today's change, and replay the session.
ATM IV history
At-the-money implied volatility session by session and through the day, with IV Rank, IV Percentile, the median and the usual range.
All Pulse charts
Every chart in Pulse with a screenshot and what it tells you.
Educational analytics only: not investment advice. You are responsible for your own trading decisions.