Buildup Radar: long and short buildup across F&O stocks
Every F&O stock on one chart: price change up the side, open interest change across, so the four kinds of buildup fall into four corners.
- What it is
- A scatter of every F&O stock, price change against open interest change, falling into four buildup corners.
- Data it uses
- Every F&O stock's near-month future: last price against previous close, open interest against the session's opening OI, and turnover.
- Covers
- NSE F&O stocks (index futures excluded)
- Updates
- Refreshed every minute during the session; today only
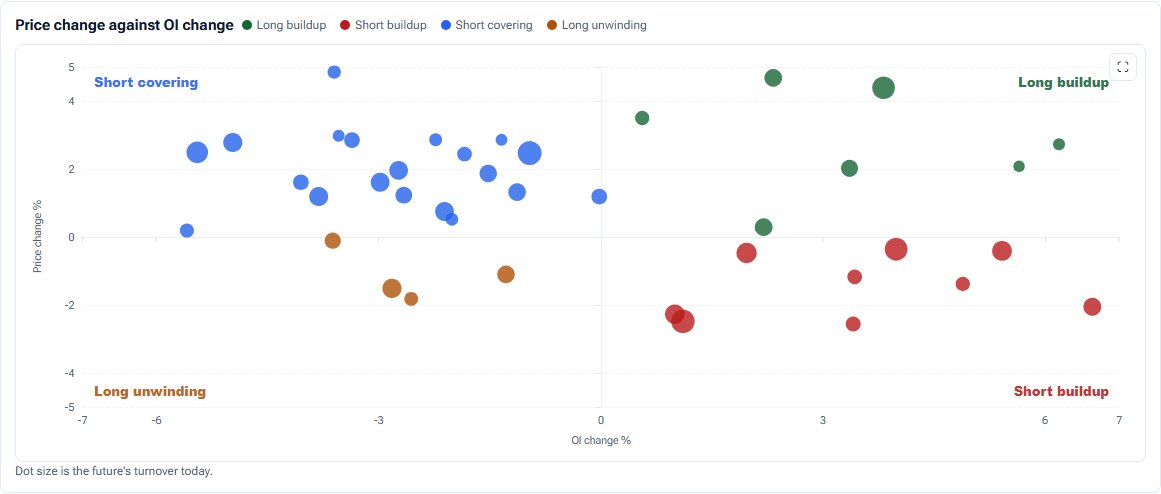
What the chart shows
- Scatter: one dot per stock, coloured by quadrant (green long buildup, red short buildup, blue short covering, amber long unwinding) and sized by today's turnover.
- Switch to a four-quadrant view with the top ten stocks in each, or a count of stocks per quadrant.
- Cards count the stocks in each quadrant.
How it is worked out
Each stock's near-month future: price change is the last price against the previous close, OI change is OI against the session's opening OI. Price up or flat with OI up is long buildup; with OI down, short covering. Price down with OI up is short buildup; with OI down, long unwinding.
How to read it
Long buildup is fresh longs; short buildup fresh shorts; short covering is shorts leaving; long unwinding is longs booking out. The farther a dot sits from the centre, the stronger the move.
Controls
- View: scatter, four quadrants or counts
Keep in mind
Buildup describes positioning, not direction. Stock futures only. It reads today's data and no past session is stored.
Buildup Radar questions
What is short buildup?
Price falling while open interest rises: new short positions are being opened.
Which stocks are included?
Every stock in NSE's F&O segment, through its near-month future.
Why are some dots larger?
Dot size follows today's turnover, so heavily traded stocks stand out.
Related tools and guides
Futures buildup
The index future against its VWAP, and open interest added in each bucket coloured as long buildup, short buildup, short covering or long unwinding.
Market Breadth
The share of NSE F&O stocks advancing and declining in each session, the advance-decline ratio, and the broadest rises and falls.
Heat maps
Twelve heat maps of NSE F&O: stock and sector moves, OI change, buildup, IV, VWAP, rollover, strike by expiry grids and the last week.
All Pulse charts
Every chart in Pulse with a screenshot and what it tells you.
Educational analytics only: not investment advice. You are responsible for your own trading decisions.