Daily net flow: FII and DII buying and selling, session by session
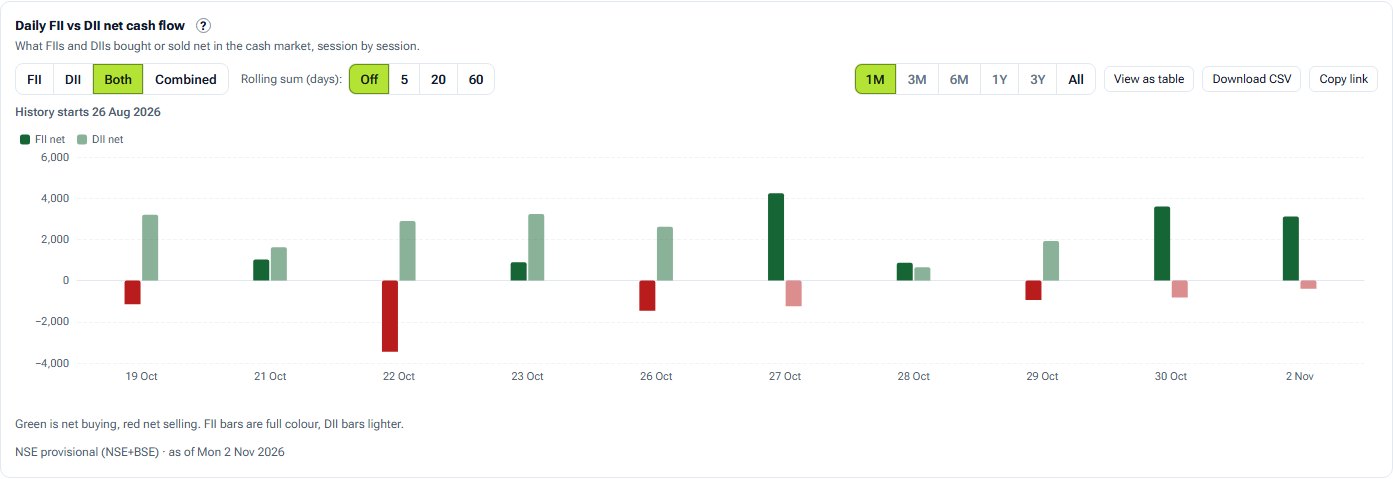
The figure most traders check each evening: how much FIIs and DIIs bought or sold net in the cash market that session, drawn as one bar per day.
- What it is
- A bar chart of what FIIs and DIIs bought or sold net in the cash market, session by session.
- Data it uses
- NSE's provisional FII/DII cash-market report: buy, sell and net in ₹ crore for each session.
- Covers
- Combined NSE, BSE and MSEI trades (the default), or NSE alone
- Updates
- Each trading day, from NSE's evening report (read between 18:30 and 21:30 IST); NSE may revise a provisional figure
- Series
- Rolling sum (days)
- Range
- Report
- View as table, with buy, sell and net
What the chart shows
- One bar per session: green above zero is net buying, red below is net selling.
- Show FII, DII, both side by side (FII in full colour, DII the same colour lighter) or the two added together.
- A rolling sum adds the last 5, 20 or 60 sessions' nets as a line on the same scale. Hover a session for both sides' buy, sell and net.
How it is worked out
Net is buy value less sell value, in ₹ crore, as NSE reports it. Combined adds FII and DII. A rolling sum adds that many sessions' nets and stays empty until that many sessions are held.
How to read it
Runs matter more than single days, and FIIs and DIIs moving in opposite directions often offset each other. Many traders read the cash figure beside FII index-futures positioning.
Controls
- Series: FII, DII, Both or Combined
- Rolling sum (days): Off, 5, 20 or 60
- Range: 1 month to all the history held
- Report: Combined (NSE+BSE) or NSE only
- View as table, with buy, sell and net
Keep in mind
Provisional exchange data. It differs from NSDL's FPI figures, which count different things, and it is not an intraday signal.
Daily net flow questions
What is the difference between FII and DII?
FIIs (foreign institutional investors, now FPIs) are investors from outside India; DIIs are Indian institutions such as mutual funds, insurers and banks. NSE reports each side's cash-market buying and selling every session.
Why does NSE's figure not match NSDL's?
NSE's daily figure is provisional secondary-market trading reported the same evening. NSDL's comes from custodians by settlement date and includes primary issues, so the two never match for the same days.
Related tools and guides
Flows vs NIFTY
FII, DII or combined net cash flow above NIFTY's or BANKNIFTY's close, on one date axis, with optional 5 and 20-session rolling sums.
Cumulative flows
FII and DII running totals of net cash-market flow, restarting each month, quarter, financial year, calendar year or from dates you pick.
Monthly flows
A month-by-year heat map of FII, DII or combined net cash flow, with yearly totals, monthly averages and each month's sessions one click away.
All FII/DII charts
Every FII/DII chart with a screenshot and what it tells you.
Educational analytics only: not investment advice. You are responsible for your own trading decisions.