Sector flows: FPI buying and selling by sector
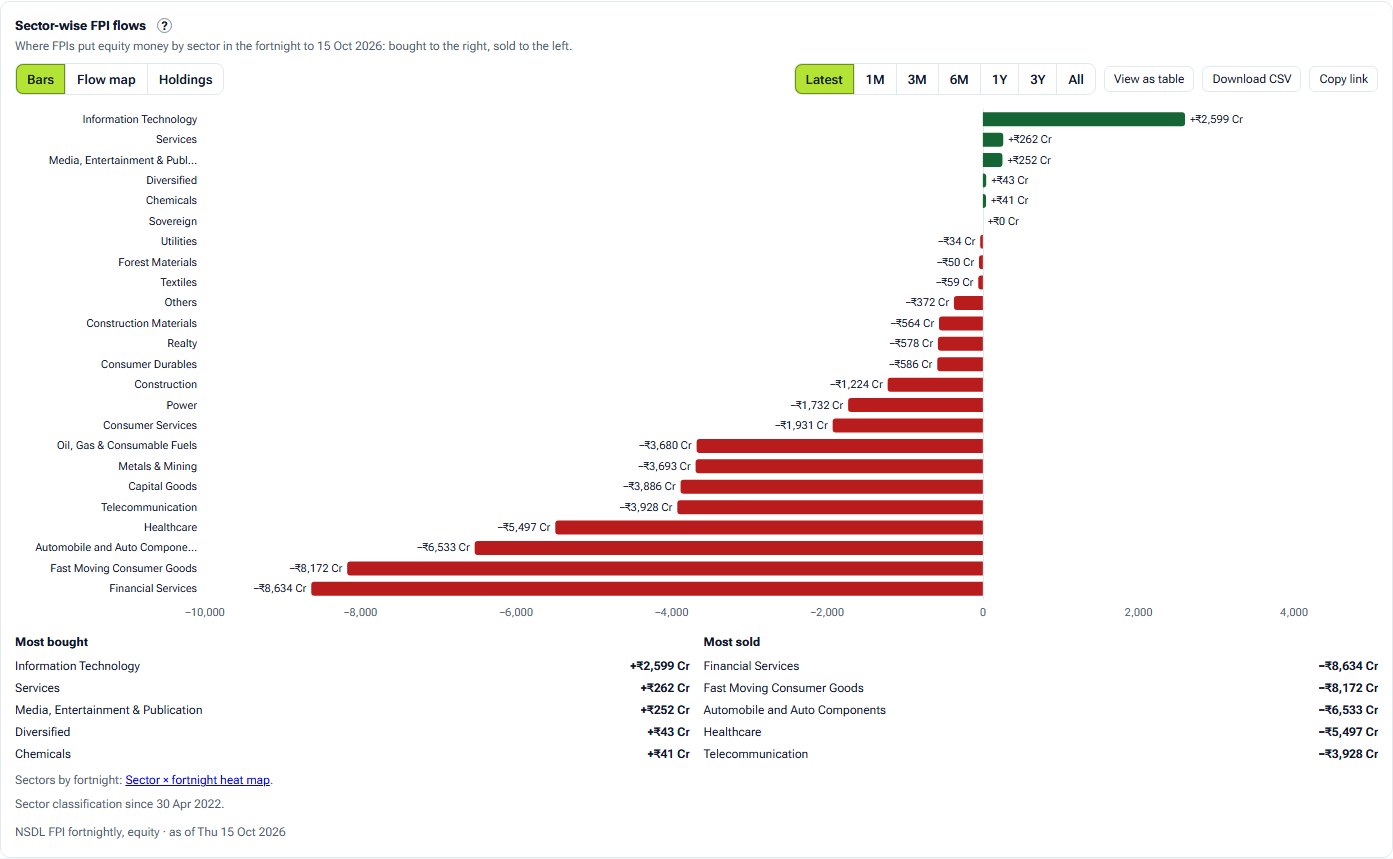
NSE's daily figure says how much FIIs bought; NSDL's fortnightly report says where. This chart shows every sector's FPI equity net for the fortnight.
- What it is
- Where foreign portfolio investors put equity money by sector in the latest fortnight, or over a longer window.
- Data it uses
- NSDL's fortnightly FPI report, equity only, in ₹ crore, with equity holdings (AUC) by sector.
- Covers
- NSDL's sector list, FPI equity investment
- Updates
- Every fortnight, after NSDL publishes
What the chart shows
- Bars: each sector's net for the fortnight, sorted, bought to the right and sold to the left.
- Flow map: each sector sized by its net flow, green bought and red sold.
- Holdings: each sector sized by its FPI equity holdings, coloured by the fortnight's flow.
How it is worked out
Each sector's net investment for the fortnight, as NSDL reports it, in ₹ crore. Over a longer window the fortnights are added.
How to read it
Read the sectors at both ends together; a large net in a big sector can be small against what FPIs already hold there, which the Holdings view shows.
Controls
- Window: the latest fortnight or a longer span
- View: Bars, Flow map or Holdings
- View as table
Keep in mind
NSDL's figures are FPI investment, a different measure from NSE's daily FII figures, so the two do not add up to each other.
Sector flows questions
How often is sector data published?
NSDL publishes FPI investment by sector every fortnight, so this chart moves twice a month, not daily.
Why don't the sector totals match the daily FII figure?
They come from different reports. NSDL counts by settlement date and includes primary-market issues; NSE's daily figure is provisional secondary-market trading.
Related tools and guides
Daily net flow
FII and DII net buying and selling in the Indian cash market for each session, from NSE's provisional report, with 5, 20 and 60-session rolling sums.
Monthly flows
A month-by-year heat map of FII, DII or combined net cash flow, with yearly totals, monthly averages and each month's sessions one click away.
Flows and the rupee
FII net cash flow, as a 20-session sum or monthly totals, above RBI's USD/INR reference rate drawn so a stronger rupee sits higher.
All FII/DII charts
Every FII/DII chart with a screenshot and what it tells you.
Educational analytics only: not investment advice. You are responsible for your own trading decisions.