FII futures long %: how much of FII index futures is long
Of all the index-futures contracts FIIs hold, what share is long? This chart tracks that figure session by session against its own history.
- What it is
- FIIs' long share of their index-futures positions against its own history, with NIFTY's close below.
- Data it uses
- NSE's participant-wise open interest for the F&O segment, published each evening. NIFTY's close.
- Covers
- NSE F&O: FIIs, DIIs, proprietary traders and clients
- Updates
- Each trading day, from NSE's evening file
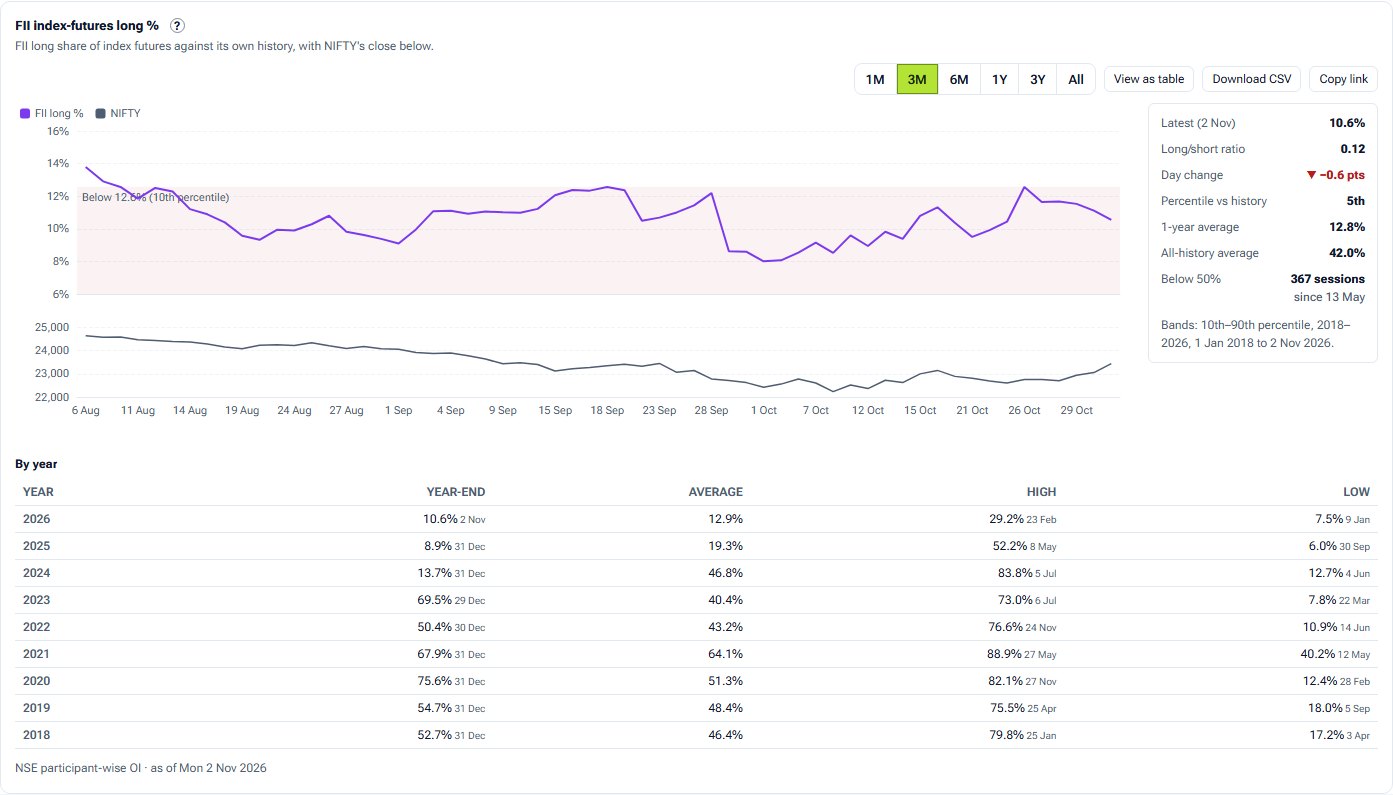
What the chart shows
- A line of FII long % with shaded bands from 0 to the 10th percentile and from the 90th to 100 of every session on record.
- NIFTY's close in a panel below on the same dates.
- Beside the chart: the latest reading, the long/short ratio, the day's change, its percentile against history, 1-year and all-history averages, and how many sessions it has been above or below 50%. A yearly table sits underneath.
How it is worked out
Long % is FII long index-futures contracts divided by long plus short. The long/short ratio is long over short. Percentiles are over every session on record.
How to read it
The bands show where the ratio has been, not what comes next. Watch the direction alongside the level: a net long position that keeps adding longs reads differently from one that is reducing them.
Controls
- Range: 1 month to all the history held
- View as table: long %, long, short and NIFTY
Keep in mind
Index futures only, in contracts. FIIs also hold options and stock futures, and a futures position can be one leg of a hedge.
FII futures long % questions
What is a low FII long %?
The chart shades the lowest tenth of every session on record. Where the line sits against those bands, and the percentile beside it, say how unusual today's reading is for this history.
Where does the data come from?
NSE's participant-wise open interest, published each evening for FIIs, DIIs, proprietary traders and clients.
Related tools and guides
Positions matrix
Long, short and net F&O positions of FIIs, DIIs, proprietary traders and clients in index futures, index calls and puts, stock futures and stock options, with the change over a day, a week or since expiry.
Flows vs NIFTY
FII, DII or combined net cash flow above NIFTY's or BANKNIFTY's close, on one date axis, with optional 5 and 20-session rolling sums.
Daily net flow
FII and DII net buying and selling in the Indian cash market for each session, from NSE's provisional report, with 5, 20 and 60-session rolling sums.
All FII/DII charts
Every FII/DII chart with a screenshot and what it tells you.
Educational analytics only: not investment advice. You are responsible for your own trading decisions.