OI by Strike: open interest across the NIFTY option chain
Where option writers have the most at stake: call and put open interest at every strike of an index chain, with the walls, max pain and spot drawn on the same chart.
- What it is
- A bar chart of open interest at every strike, calls against puts, with the walls, max pain and spot marked.
- Data it uses
- NSE option chain: open interest, change in OI, last price and volume for every strike; the index spot.
- Covers
- NIFTY, BANKNIFTY, FINNIFTY, MIDCPNIFTY and NIFTY NEXT 50
- Updates
- Through the session as NSE's data arrives (15 minutes delayed); past sessions can be opened, and today can be replayed minute by minute
What the chart shows
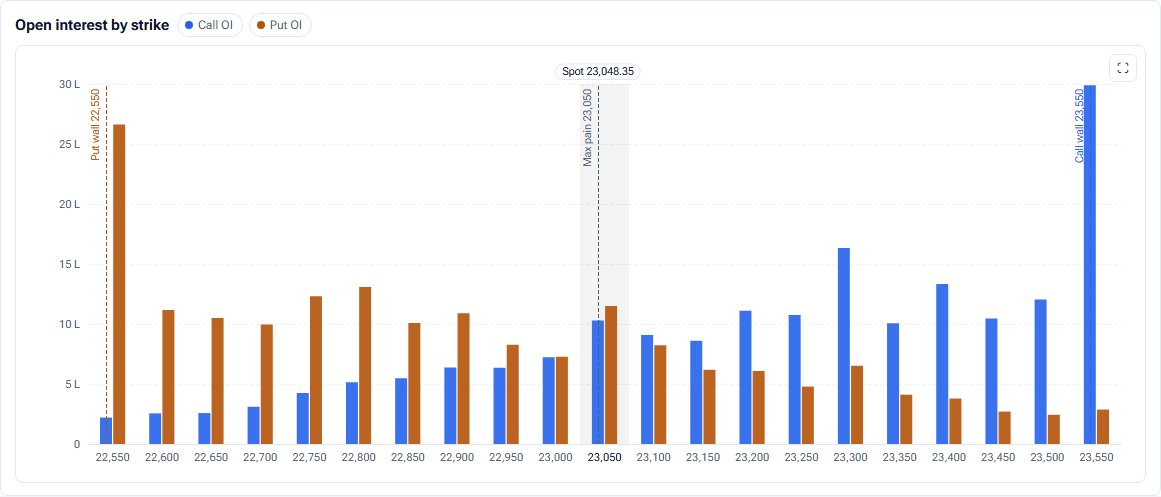
- Grouped bars, one pair per strike: call OI in blue, put OI in orange. Dashed, labelled lines mark spot, max pain, the call wall and the put wall.
- Switch the bars to today's change in OI, or show both, with the change drawn as faded bars beside the open interest.
- Above the chart, cards give the two biggest call and put walls on each side, the whole-chain PCR, total call and put OI with today's change, and max pain. Below it, a strike table lists OI, change, price and the buildup of each leg.
How it is worked out
The call walls are the two strikes with the most call OI at or above spot; the put walls are the two with the most put OI at or below spot. PCR (OI) is put OI divided by call OI across the selected expiry. A leg's buildup comes from its price change against its OI change; small moves (OI change under 2% of the strike's OI, or a price move under 1%) are left unnamed.
How to read it
Large call OI above spot and large put OI below it are where writers have the most to lose, so traders often treat them as resistance and support. Watch the change bars to see which side is being added today and whether a wall is being built or abandoned.
Controls
- Session: today, or a stored past session
- Expiries: one, or several summed together
- Strikes: All, or ±5 to ±25 around the money, or a custom range
- Show: OI, Δ OI or both
- Replay: drag to any minute of today's session
Keep in mind
Open interest describes positioning, not direction. A wall is a concentration of open contracts, not a promise that price will stop there.
For the idea behind the chart, read Reading the option chain.
OI by Strike questions
What is a call wall?
The strike above spot with the most call open interest. Call writers there lose if the index rises through it, which is why traders watch it as a ceiling. EzyOptions marks the two largest on each side.
Can I see open interest for several expiries at once?
Yes. Pick more than one expiry and open interest, its change and volume are summed across them. Prices are shown as a dash then, because a price belongs to one contract.
Which indices does it cover?
NIFTY, BANKNIFTY, FINNIFTY, MIDCPNIFTY and NIFTY NEXT 50, from NSE's F&O data.
Related tools and guides
Change in OI
Today's change in call and put open interest at every strike: who is writing, who is covering, and what changed in the last 15, 30 or 60 minutes.
Max Pain
Total rupee pain to option buyers at every strike, the max pain strike against spot, max pain for the next four expiries and session by session.
OI × time
A strike-by-time heat map of open interest added since 09:15, for calls, puts or puts minus calls, plus the call and put walls minute by minute.
All Pulse charts
Every chart in Pulse with a screenshot and what it tells you.
Educational analytics only: not investment advice. You are responsible for your own trading decisions.