Pulse charts: options analytics for NIFTY and NSE F&O
Pulse is the EzyOptions market dashboard: open interest, volatility, futures and the whole F&O market, drawn from NSE's F&O data (15 minutes delayed). Each chart below has its own page with a screenshot of the chart, how it is worked out and how to read it.
Index charts cover NIFTY, BANKNIFTY, FINNIFTY, MIDCPNIFTY and NIFTY NEXT 50. Market charts cover every NSE F&O stock.
OI & Volume
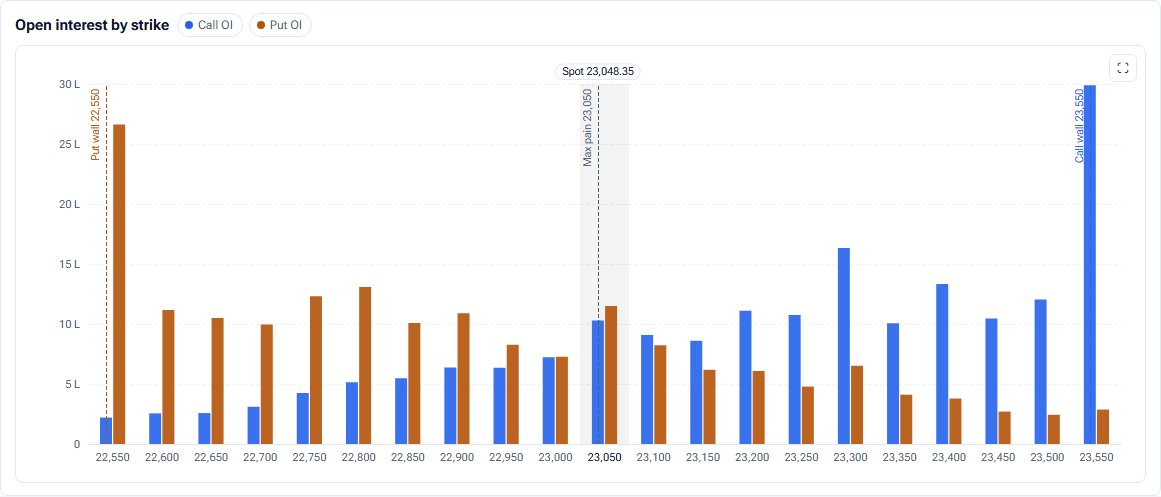
OI by Strike
Call and put open interest at every strike, with call and put walls, max pain and spot marked. Sum several expiries, show today's change, and replay the session.
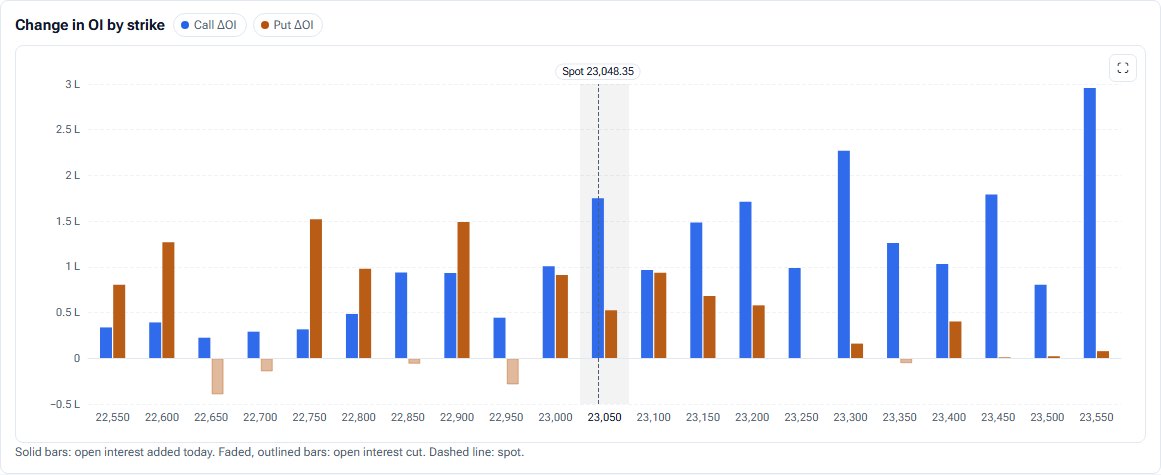
Change in OI
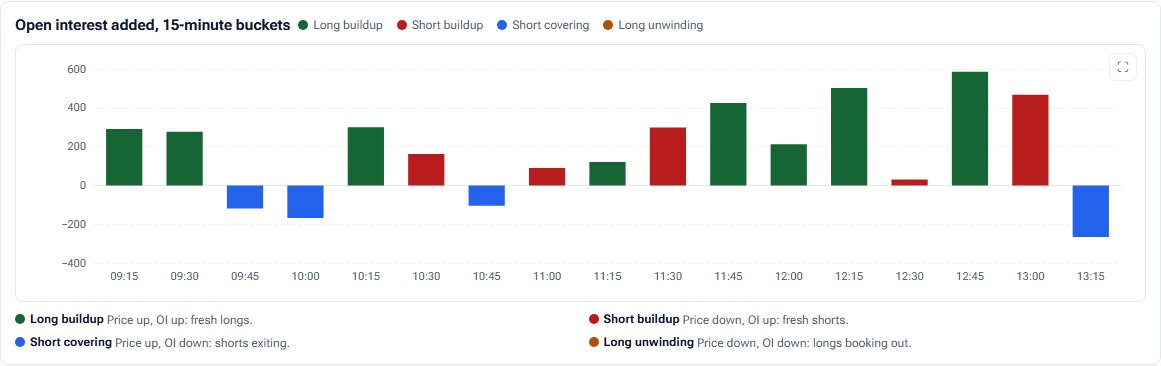
Today's change in call and put open interest at every strike: who is writing, who is covering, and what changed in the last 15, 30 or 60 minutes.
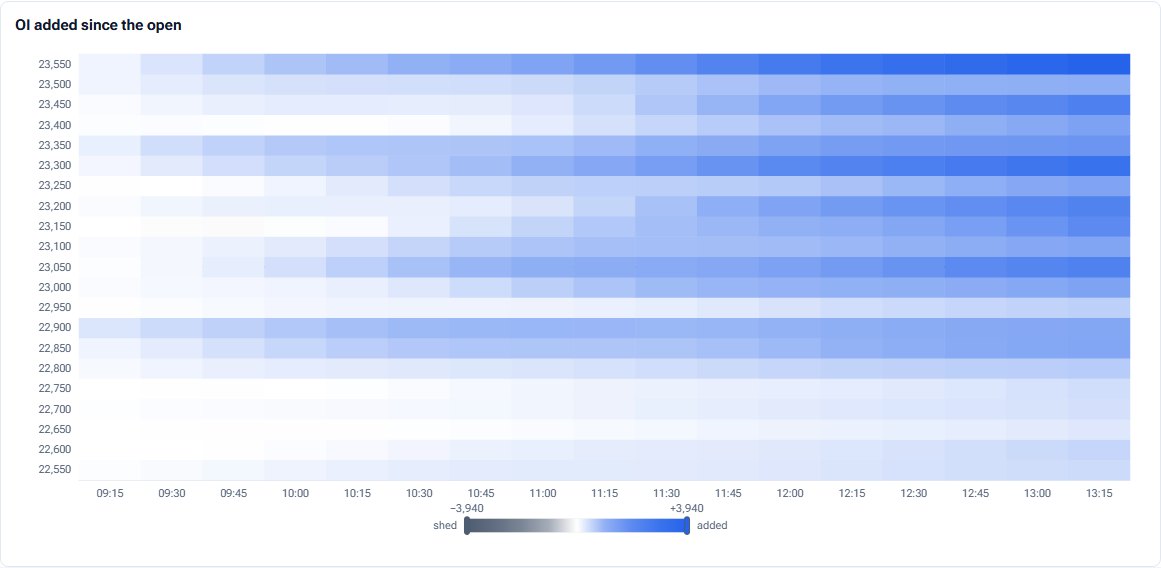
OI × time
A strike-by-time heat map of open interest added since 09:15, for calls, puts or puts minus calls, plus the call and put walls minute by minute.
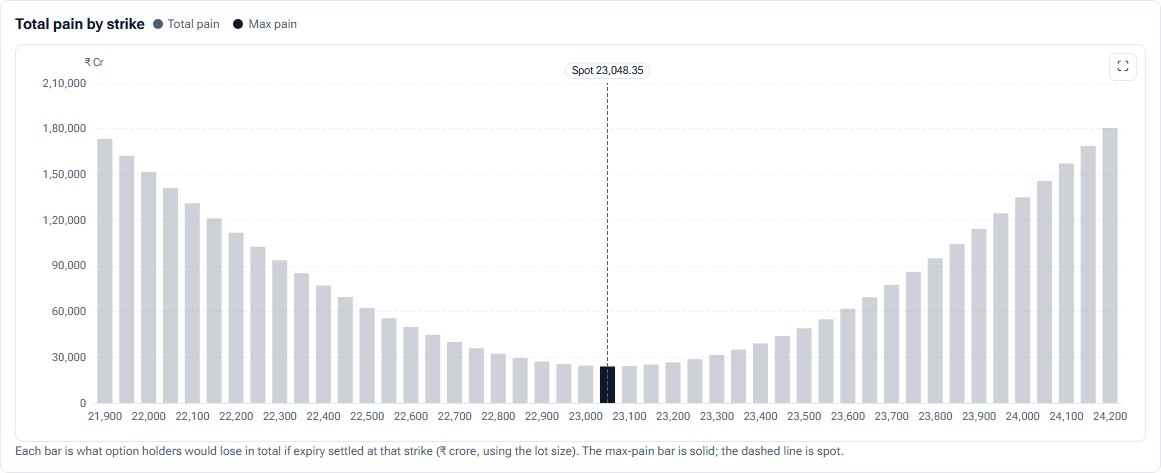
Max Pain
Total rupee pain to option buyers at every strike, the max pain strike against spot, max pain for the next four expiries and session by session.
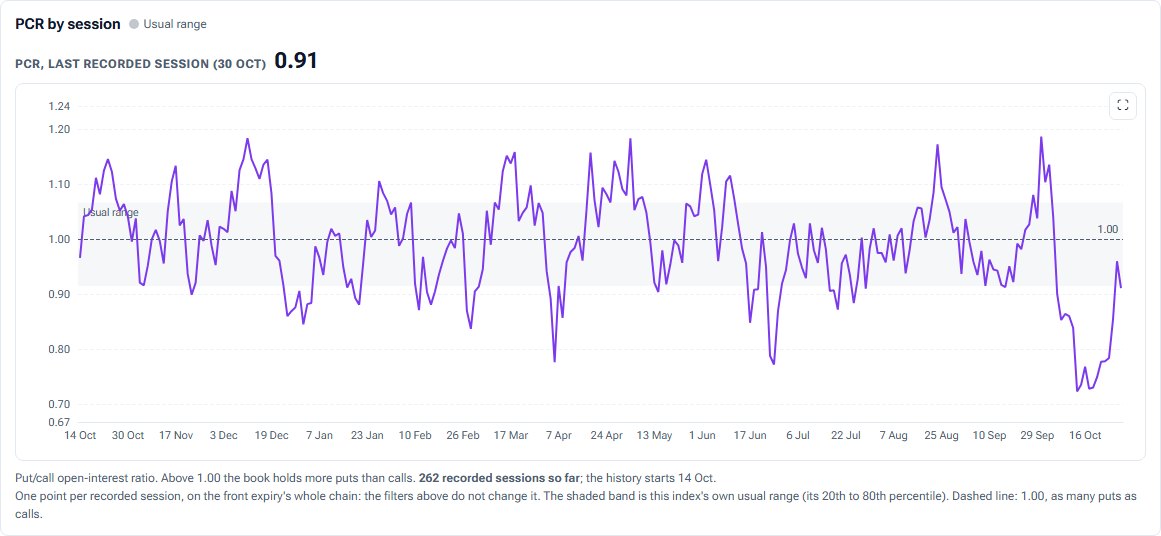
PCR history
The index's put-call ratio session by session against its own usual range, and minute by minute through today, with OI, volume and OI-added PCR.
Volatility & Premium
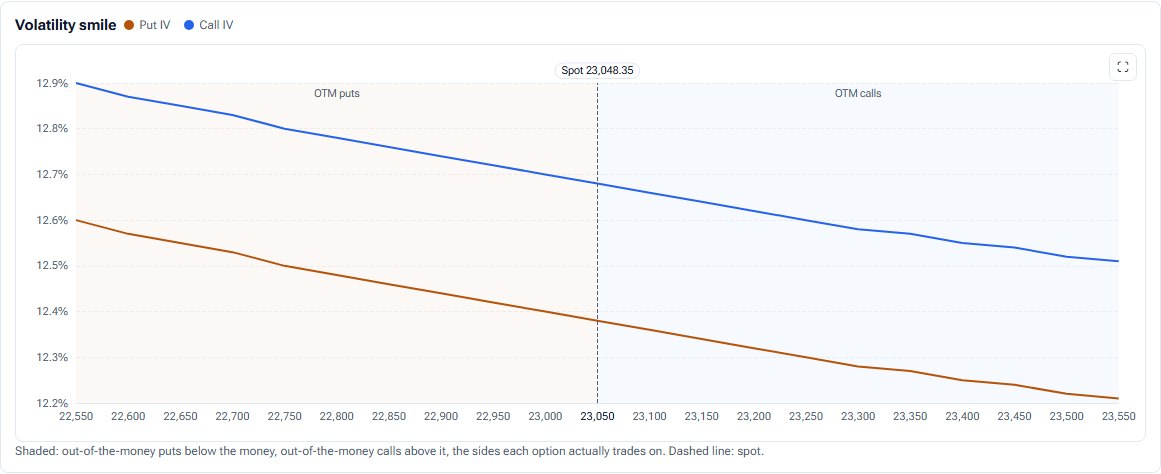
IV Skew
Implied volatility at every strike for calls and puts, the 5% put-call skew, and ATM IV across the next six expiries.
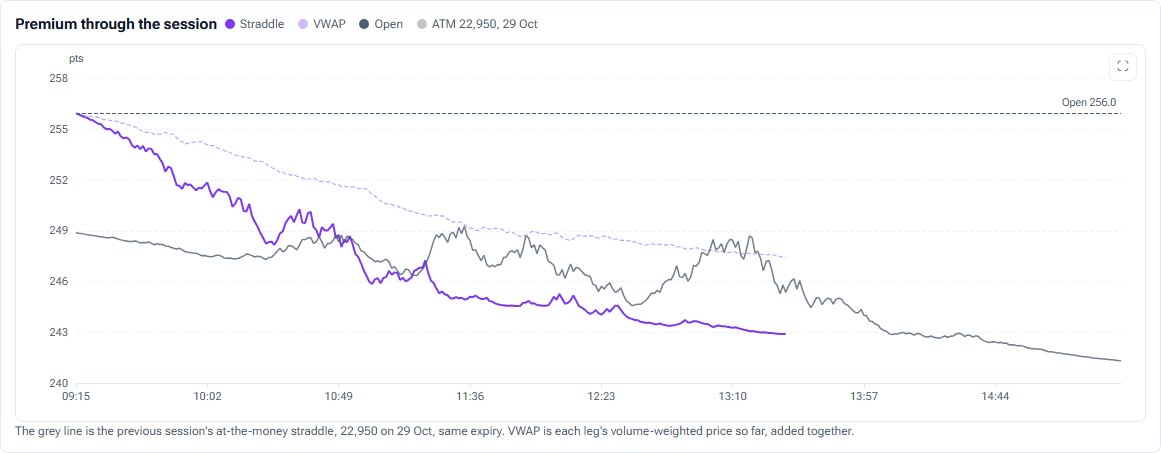
Straddle Premium
The at-the-money call plus put premium through the session with its VWAP, the auto-ATM line, time value and decay per hour, from NSE minute bars.

Expected move
The index range options are priced for, from the ATM straddle and from implied volatility, for the next six expiries, scored against how far the index actually moved.
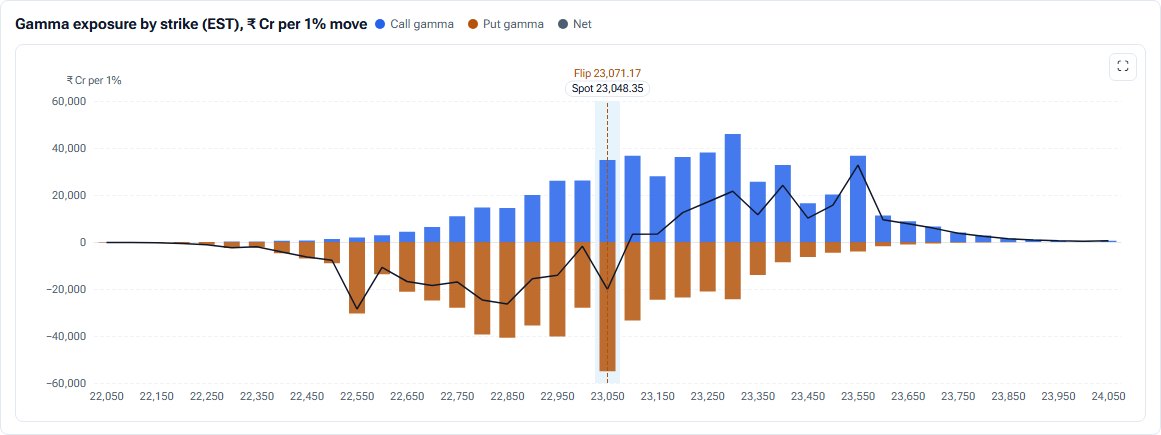
Gamma exposure
Estimated dealer gamma at every strike in ₹ crore per 1% move, the net GEX regime and the flip level, worked out from the option chain.
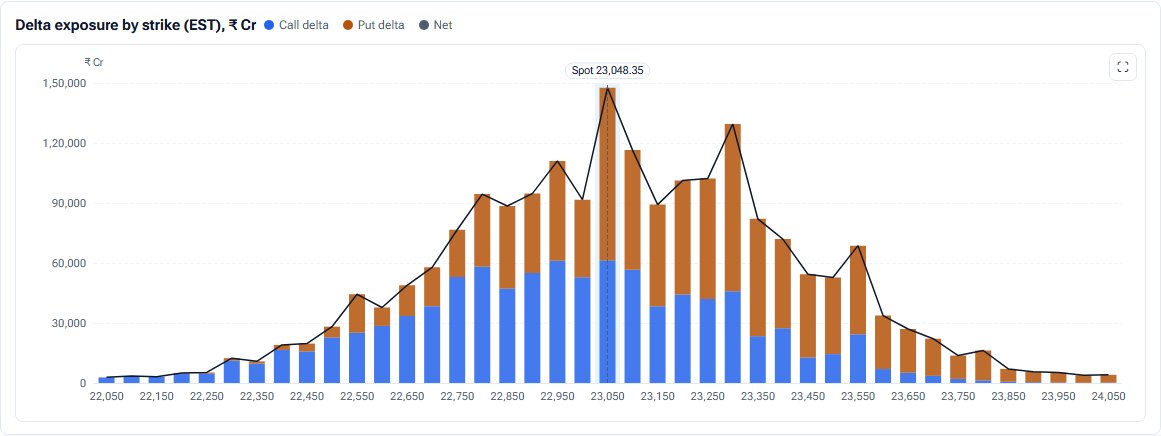
Delta exposure
Estimated dealer delta at every strike, today's change, and the futures hedge it implies, in ₹ crore or lots, on the same dealer model as GEX.
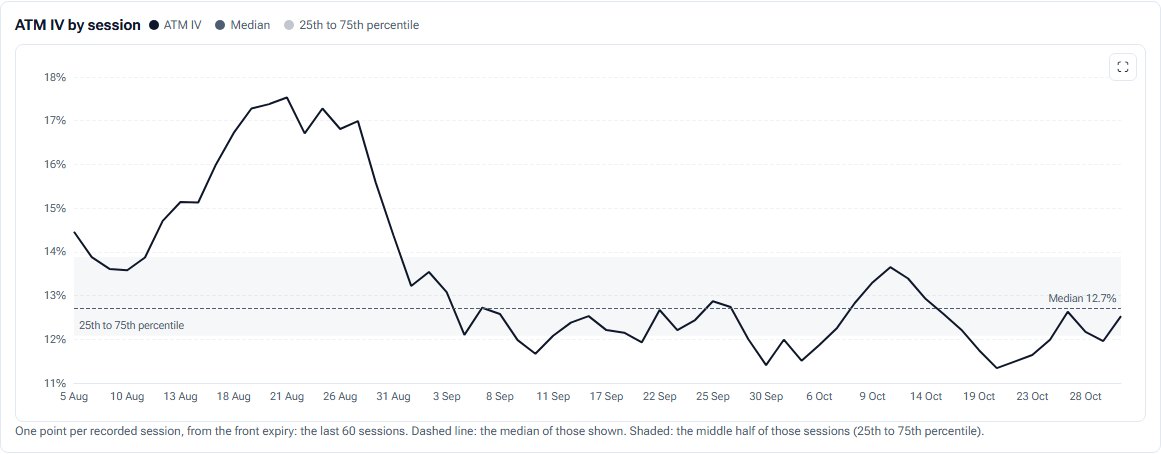
ATM IV history
At-the-money implied volatility session by session and through the day, with IV Rank, IV Percentile, the median and the usual range.
Broader market
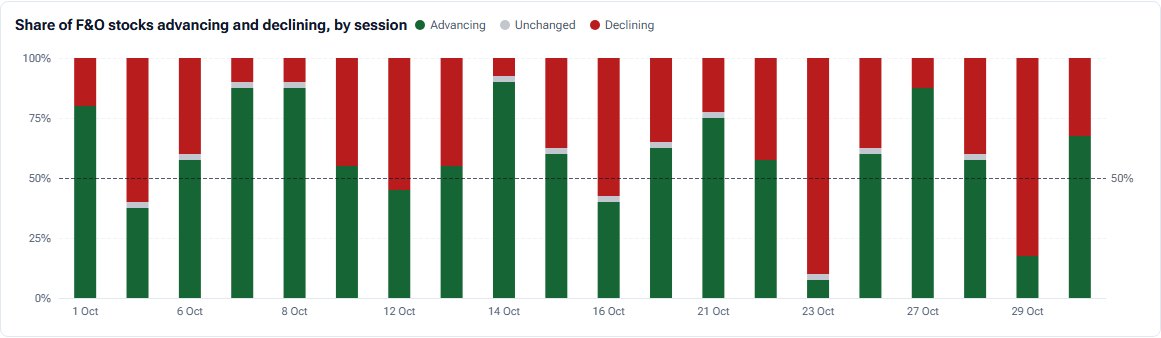
Market Breadth
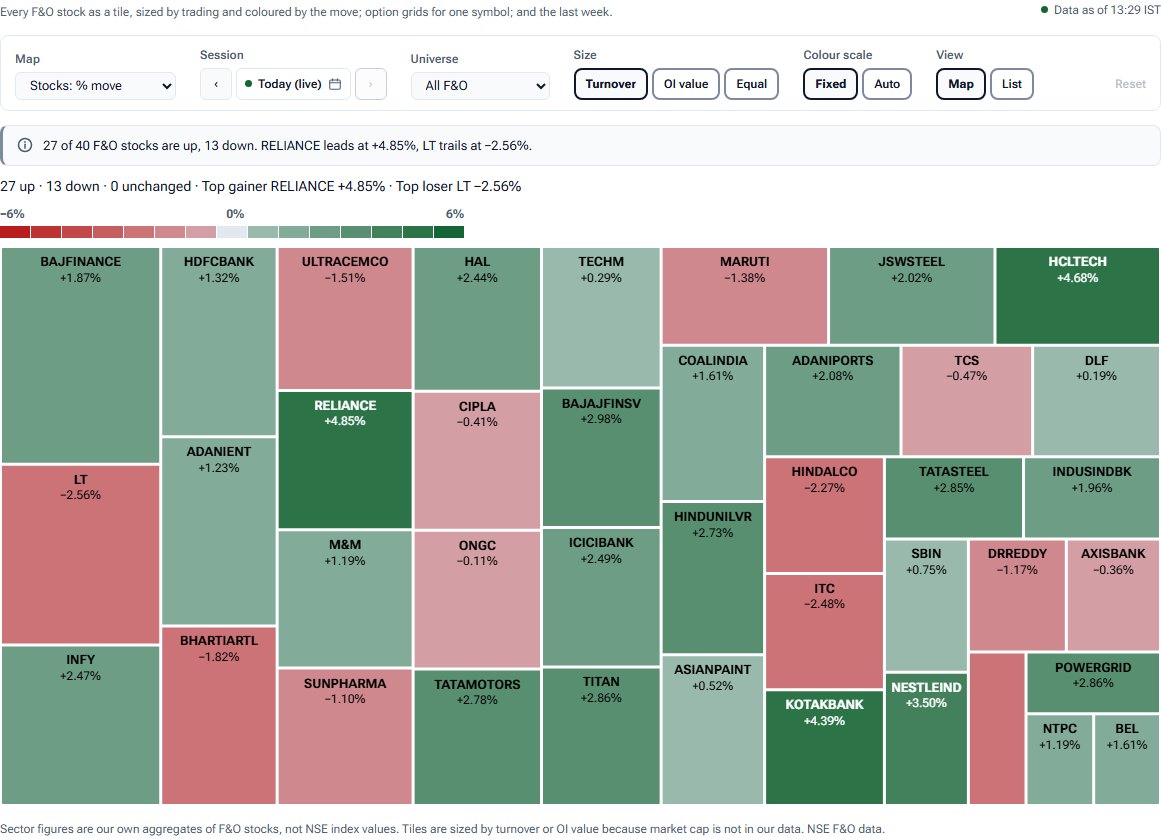
The share of NSE F&O stocks advancing and declining in each session, the advance-decline ratio, and the broadest rises and falls.
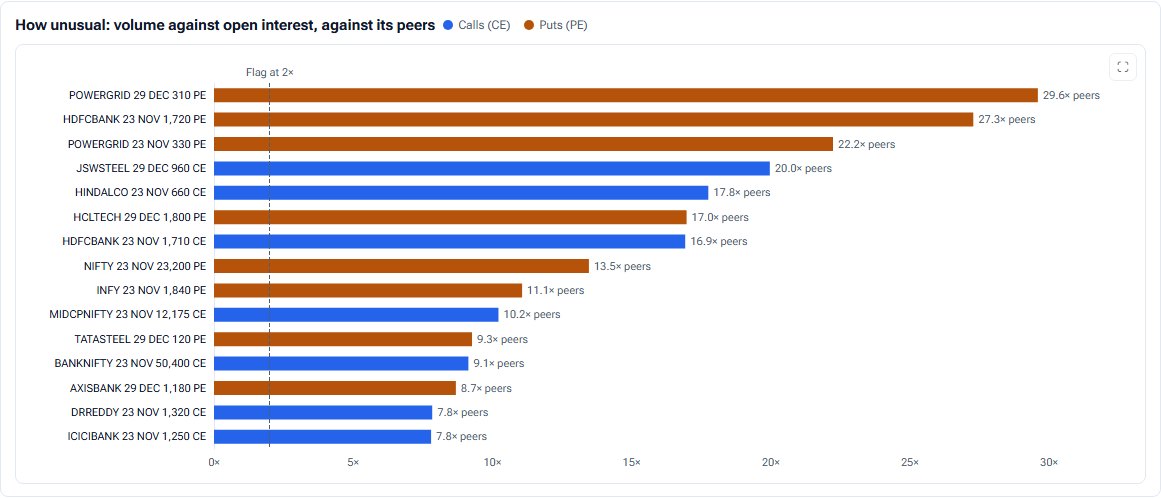
Unusual activity
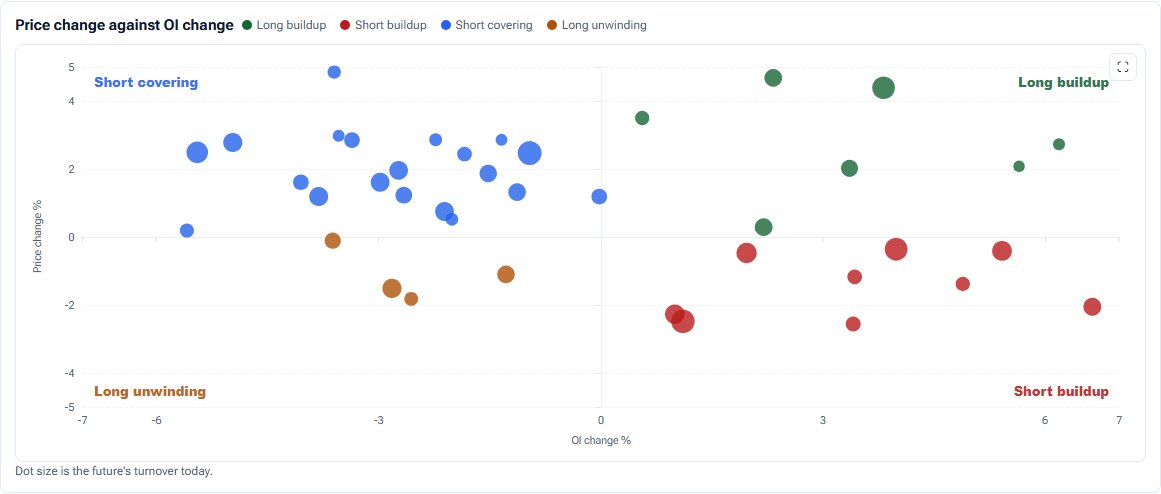
Index and stock options trading far heavier than their neighbouring strikes, ranked by volume against open interest, plus one-minute volume bursts.
Related tools and guides
Educational analytics only: not investment advice. You are responsible for your own trading decisions.