FII/DII charts: institutional flows in Indian markets
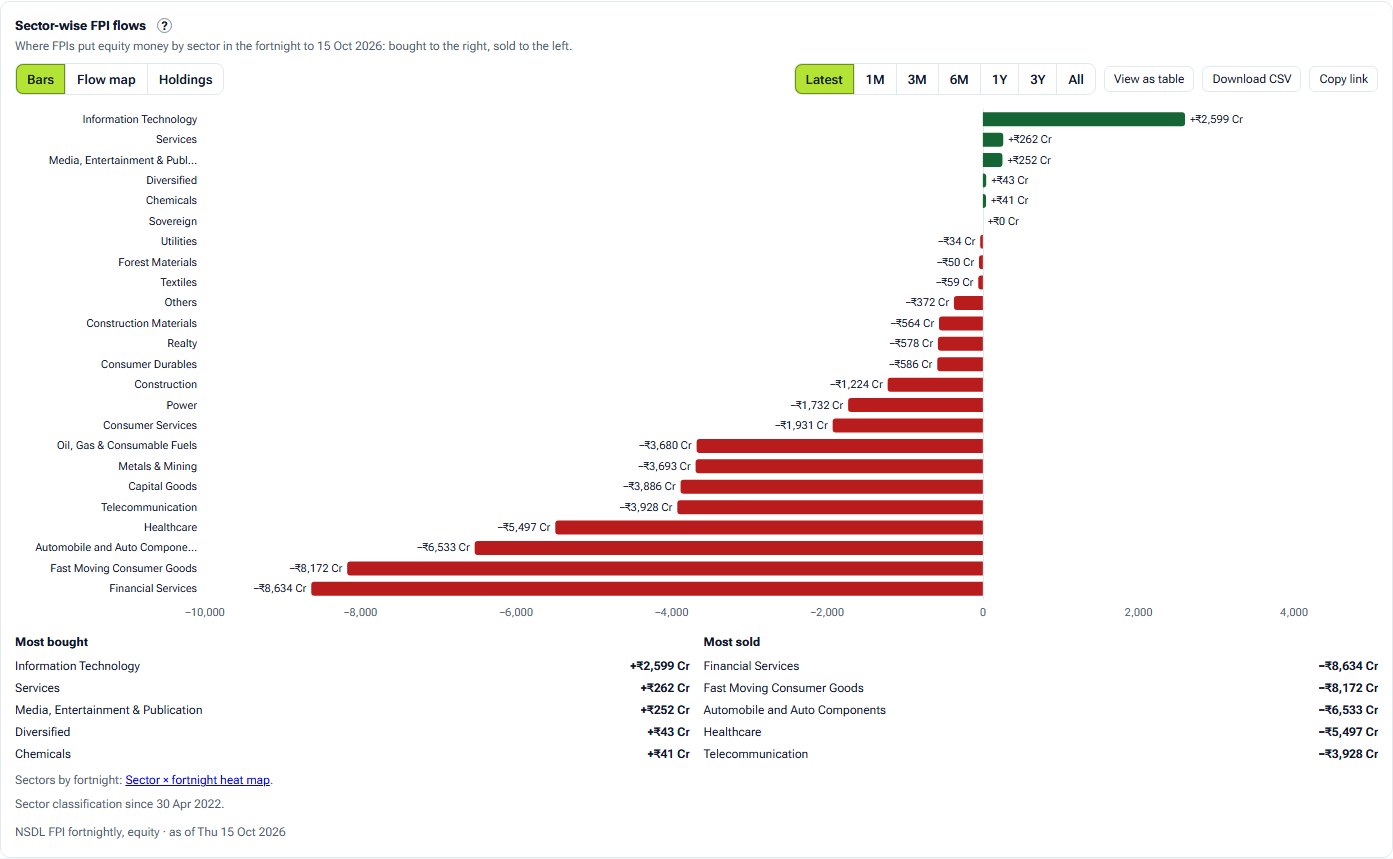
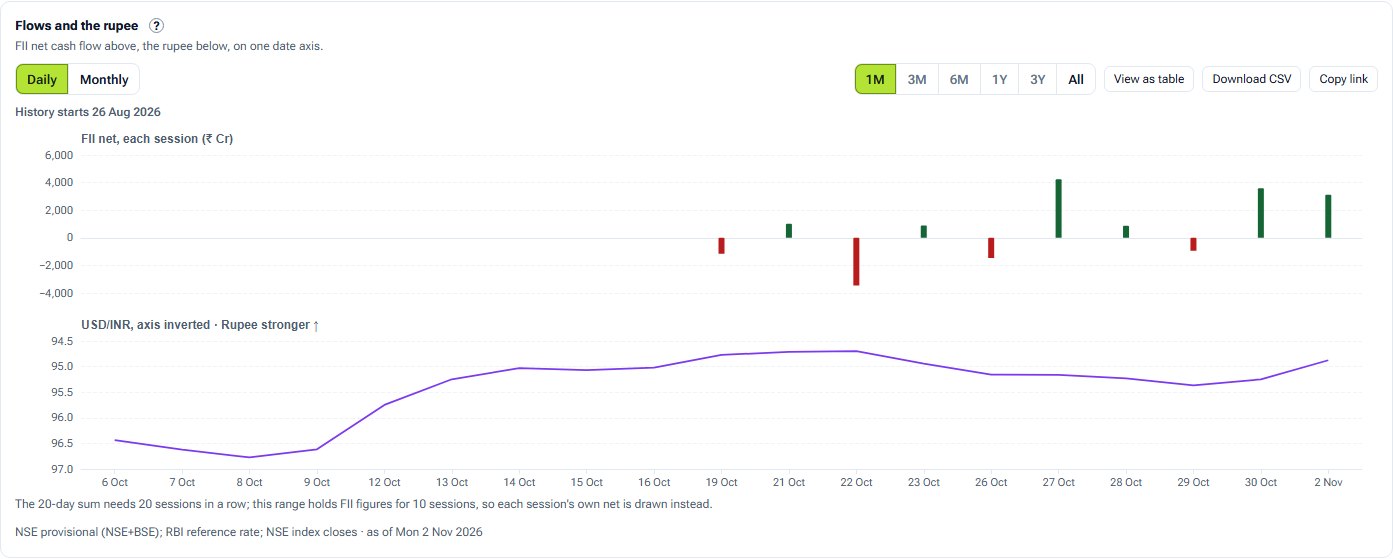
What foreign and domestic institutions bought and sold in the cash market, how they are positioned in F&O, where foreign investors put money by sector, and how flows sit against the rupee. Each chart below has its own page with a screenshot, how it is worked out and how to read it.
Cash and derivatives figures are NSE's, published each trading-day evening. Sector figures are NSDL's fortnightly FPI report; the exchange rate is RBI's USD/INR reference rate.
Cash market
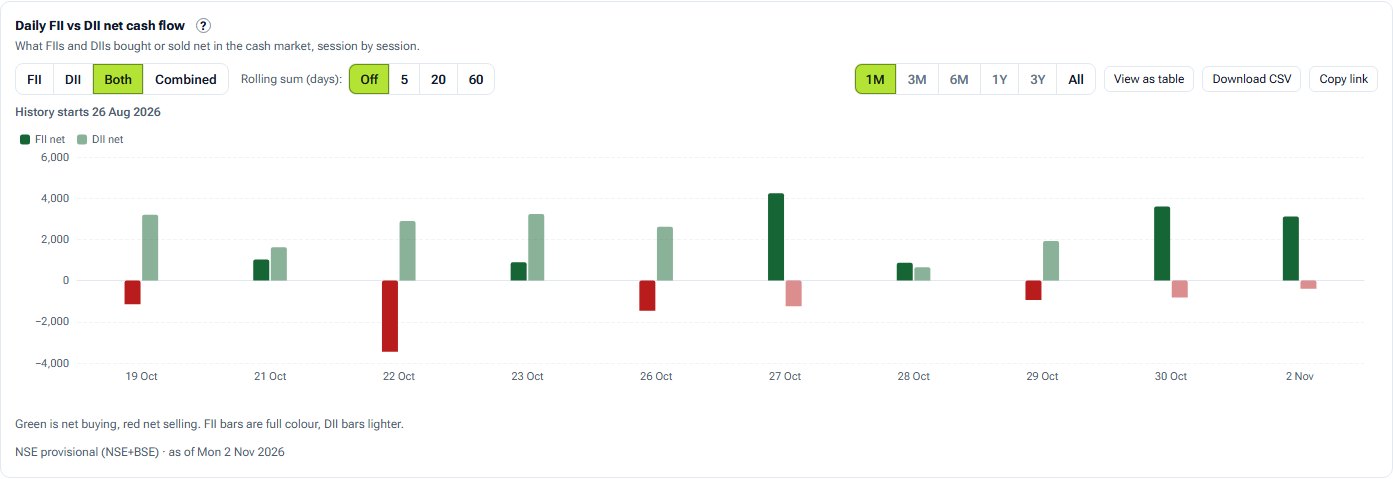
Daily net flow
FII and DII net buying and selling in the Indian cash market for each session, from NSE's provisional report, with 5, 20 and 60-session rolling sums.
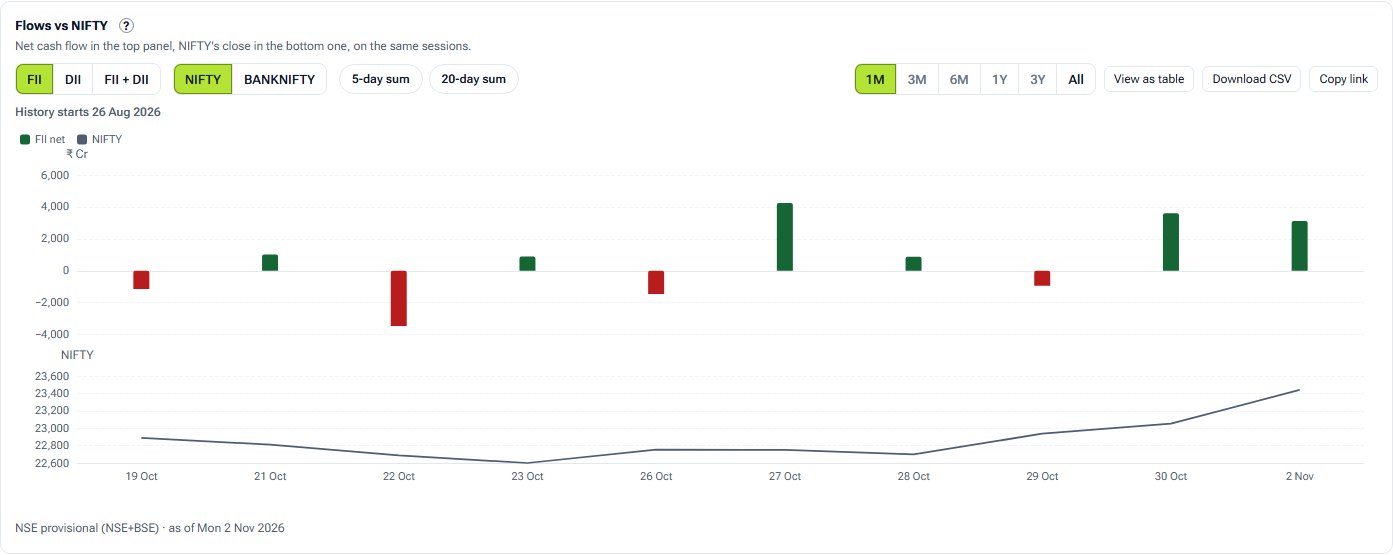
Flows vs NIFTY
FII, DII or combined net cash flow above NIFTY's or BANKNIFTY's close, on one date axis, with optional 5 and 20-session rolling sums.
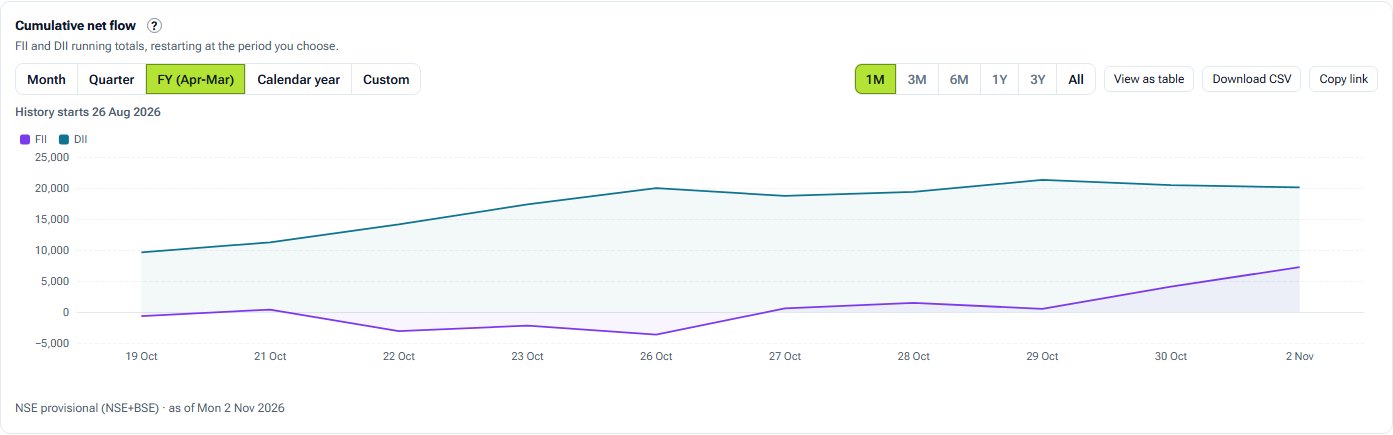
Cumulative flows
FII and DII running totals of net cash-market flow, restarting each month, quarter, financial year, calendar year or from dates you pick.
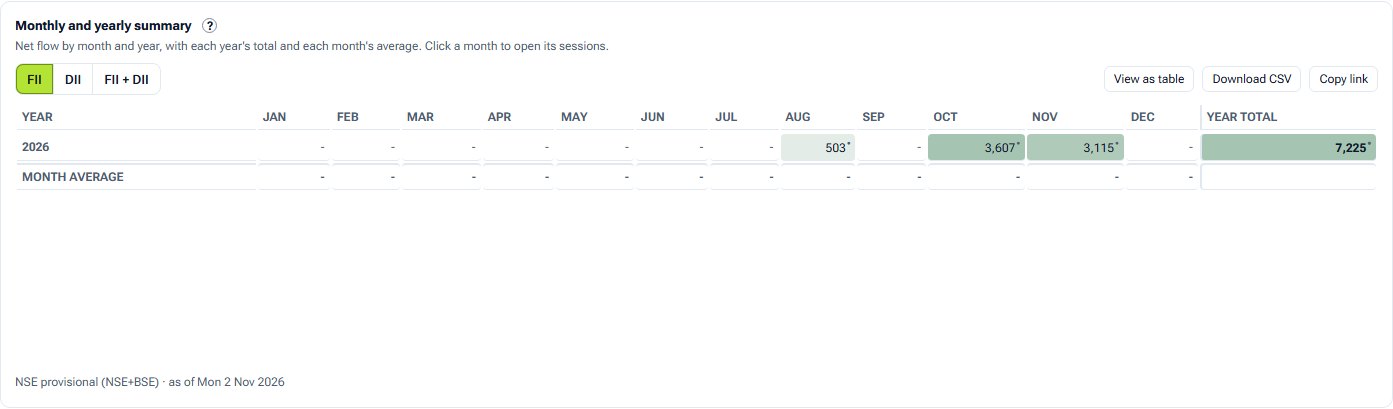
Monthly flows
A month-by-year heat map of FII, DII or combined net cash flow, with yearly totals, monthly averages and each month's sessions one click away.
Derivatives
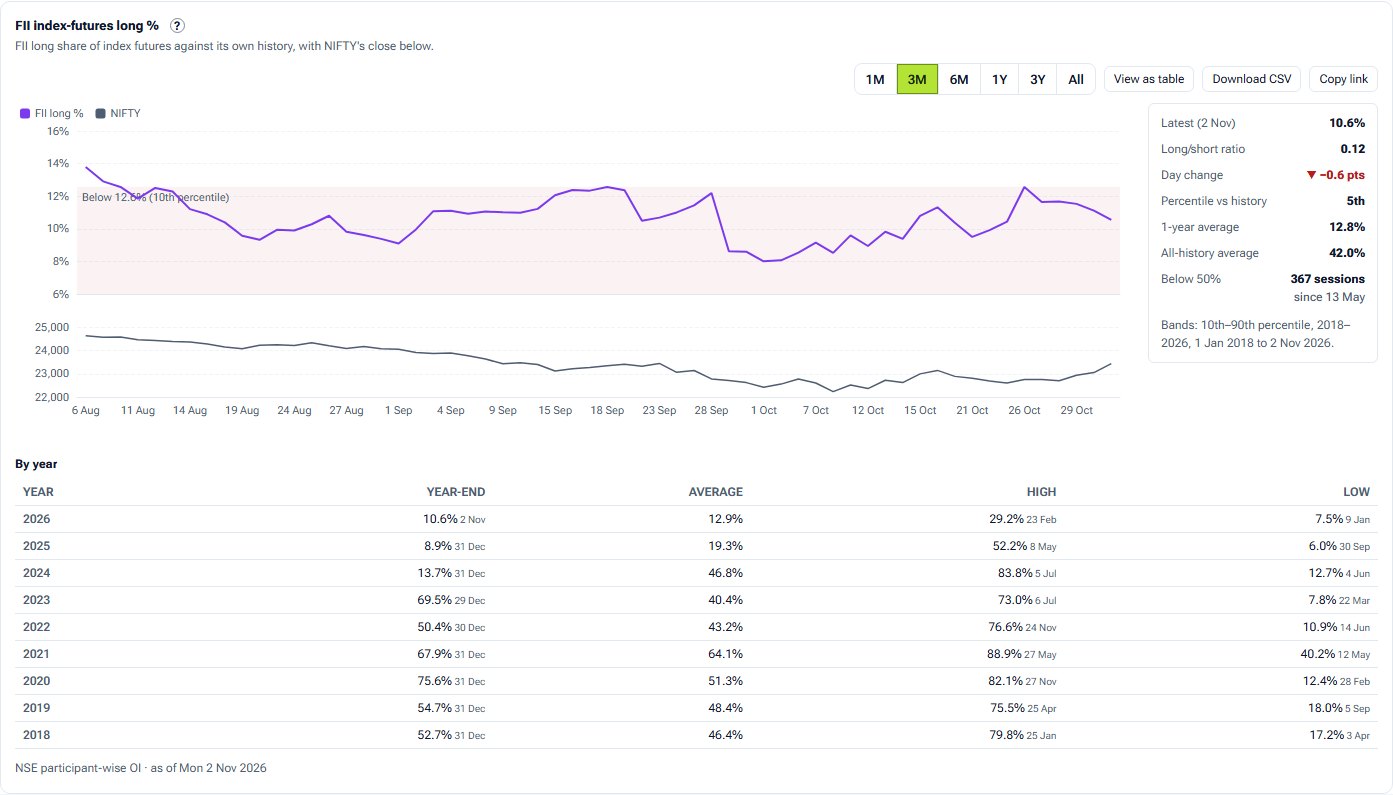
FII futures long %
FII long contracts as a share of their index-futures positions, against bands from their own history, with NIFTY below, the long/short ratio and a yearly table.
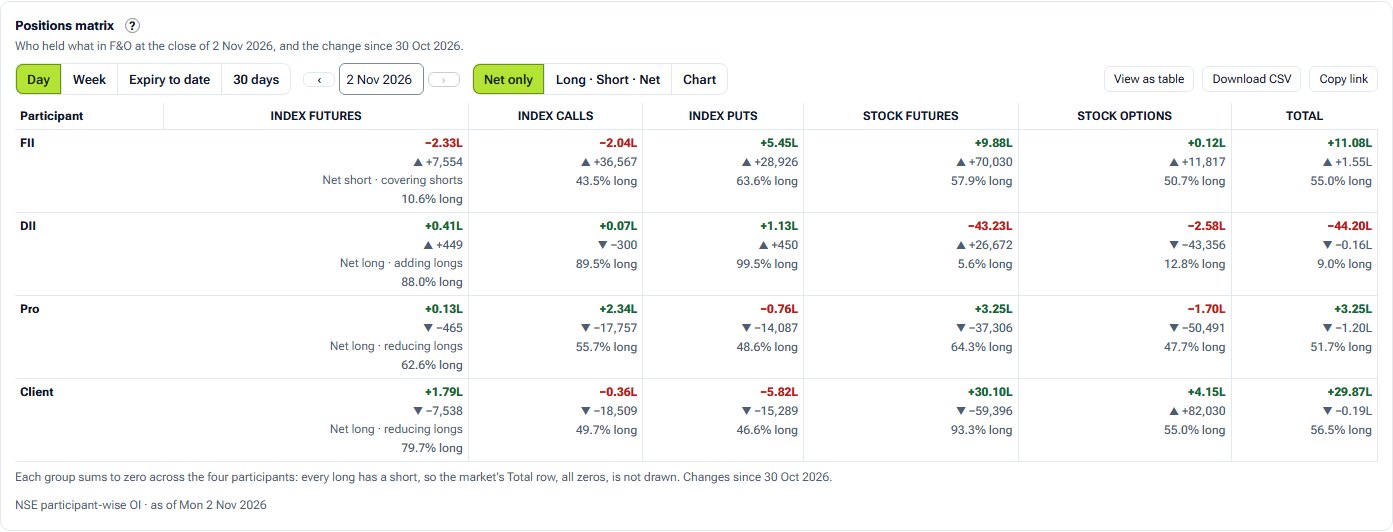
Positions matrix
Long, short and net F&O positions of FIIs, DIIs, proprietary traders and clients in index futures, index calls and puts, stock futures and stock options, with the change over a day, a week or since expiry.
Related tools and guides
Educational analytics only: not investment advice. You are responsible for your own trading decisions.